
In this Google Search Console course we will see in detail each of the sections that make it up and how to use it to analyze the SEO of a website.
Google Search Console is ideal for analyzing the traffic, links and statistics of a website we own. With it we can know key aspects such as the number of visits and impressions through search engines or the average position of the articles.
Although throughout this SEO course we have used this tool for other purposes such as, for example, obtaining keyword recommendations, this time we will delve a little deeper into other aspects.
The only prerequisite to use this tool is that you have the Google Search Console property configured. Once done, you can log in to Search Console and follow the steps in the Google Search Console tutorial for SEO.
Overview in Google Search Console
In the overview section of Google Search Console we can find the following information:
- Performance, impressions and visits of the website. Chart that shows, by default, the number of clicks to the articles on our website ordered by date.
- Coverage or SEO indexing errors. Graph with the number of valid pages and indexing errors on our website.
- Experience. Bugs and improvements, such as website mobile compatibility or HTTP errors.
- SEO improvements and recommendations. List of SEO improvements that we can apply to our website.
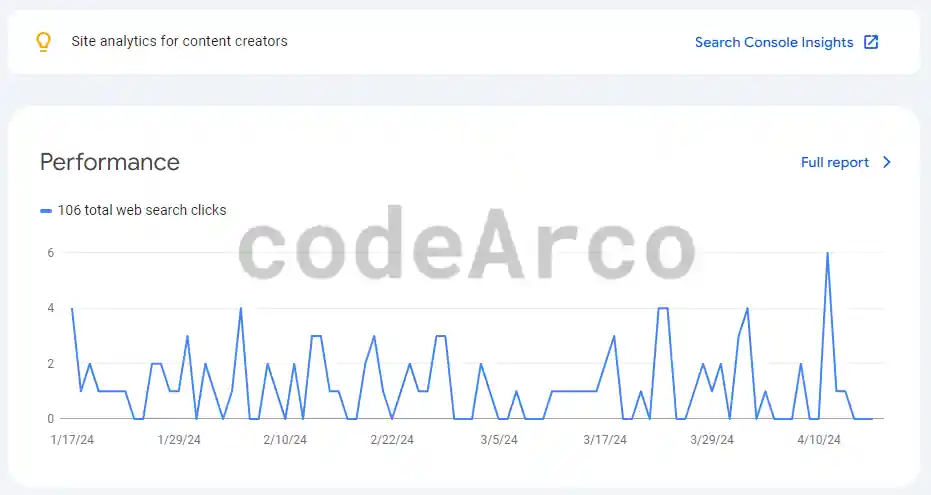
In all of them, if we click on “Full report”, we will see more specific details that we will analyze in the following sections of this Google Search Console course.
Performance, impressions and web visits
This section shows performance information at the search level of our website. It is made up of two sections, a graph with traffic statistics and a table with traffic data segmented by various factors.
The default filters that we find within this section are the following:
- Search type. This can be web, image, video or news. It is the type of search that the user performs. Furthermore, this section allows us to compare various types of search.
- Date range. Start date and end date in which the statistics to be displayed are included. Again, multiple date ranges can be compared.
Additionally, if we click on “New”, we can apply the following filters from the performance section:
- Query. Text of the query that we want to analyze, for example, “used cars”.
- Specific page or URL to analyze, that is, we can inspect all this data for a single article on our website.
- Country. In case we want to analyze a specific country, interesting from the point of view of International SEO.
- Device. As before, in case we want to analyze the traffic only from a specific device (PC, mobile, tablet). Interesting from the point of view of mobile usability or mobile friendly.
Web traffic in Google Search Console
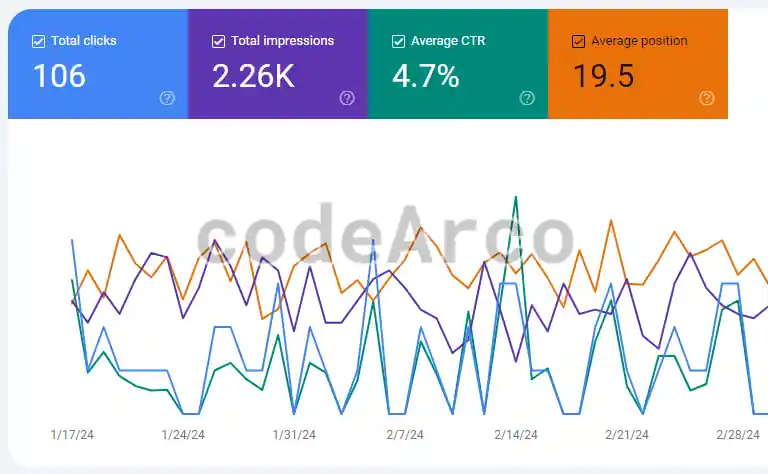
Regarding the first section, the Google Search Console web traffic statistics graph, we have the following information:
- Total clicks. Number of clicks or visits through the search engine over time.
- Total impressions. Number of times a specific web page is printed in search results.
- Average CTR. Percentage calculated as “Total Clicks / Total Impressions” that indicates, for every 100 impressions, how many times the user has clicked on one of our posts.
- Average position. Indicates the average position that our articles occupy in Google results.
Segmented web traffic
Regarding the second section, the table with segmented web traffic data from Google Search Console shows us the following information:
- Search queries. It is the text that the user enters in the search engine. Very useful to know a little more about our audience, how they write and how they find us. It is also interesting to learn new keywords or topics to talk about.
- Websites. List of articles on our website with their statistics, such as the number of clicks or the number of impressions.
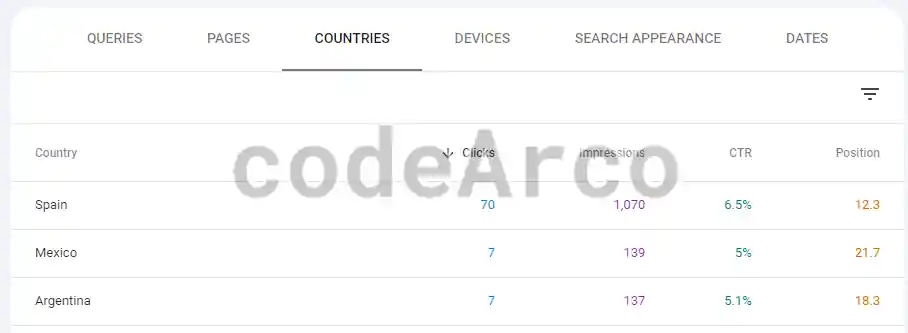
- Countries. Origin of visitors, interesting from the point of view of International SEO.
- Devices. Devices through which the user visits our website. Interesting from the point of view of mobile optimization.
- Visiting dates. List of dates on which visits, impressions and queries have been made.
For all sections, the options of the selected graph will be shown, that is, clicks, impressions, CTR and average position in the search engine.
Additionally, if we click on any of the rows, all the statistics will be reloaded but only for that data. For example, if we click within “Countries” to a specific row, we will get all these statistics only for the selected country.
Indexing errors and URLs inspection
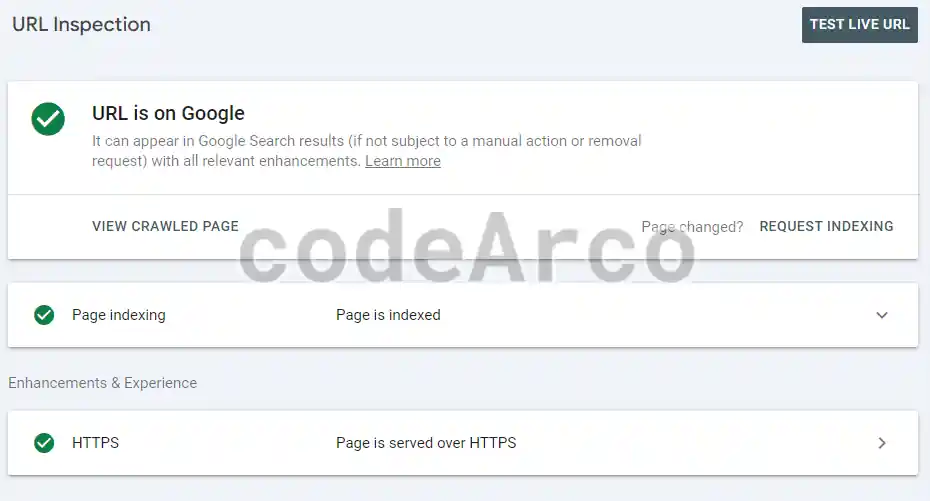
The URL inspection section of Google Search Console allows us to know information mainly about indexing and errors of a specific website. This section is important to avoid SEO penalties.
The first thing we must do is enter the URL of an article and, then, you will have a screen similar to the following:
The information we can access in URL inspection is:
- Test live url. This button will allow us to perform a real-time test of our page and compare it with what is actually indexed in the Google index.
The difference between “View crawled page” and “View tested page” is that the crawled page is what is currently indexed in Google and the tested page is the data from the test we have done, that is, the data in real and current time. - Request indexing, allows, for both indexed and non-indexed pages, to request Google to index them. It is not an immediate process since the page will enter a queue and will be processed when Google can.
- Page indexing. Data regarding whether the URL can be indexed and crawled, such as page status or the last crawl or sitemap used to detect it.
This section is interesting because it allows you to know the canonical URLs of a specific article, both those declared by the user and those selected by Google.
Canonical urls or canonical rel allow search engines to be told that several pages are similar or very similar, choose one of them as the “original” and thus avoid SEO penalties for duplicate content. - Improvements and experience. Improvements proposed by Google for the page introduced.
If we click on view tested page or view crawled page we will find the following information:
- HTML content of the page.
- Screenshot of the page (only available in the real-time test, not what’s in the Google index).
- Server response when making that request.
- Page resources with a list of errors. For example, image redirect errors or locks of the robots.txt file.
- JavaScript console messages. Javascript messages and errors that can affect automatic indexing performed by web spiders.
Indexing pages in Google Search Console
The indexing page section of Google Search Console allows us to know what we have indexed in Google and the indexing errors. In the upper left we can select which elements we want to see:
- All known pages. Recommended, are all the pages on our website that Google knows about.
- All pages sent. Only the pages that we have manually indexed in Google through a sitemap.
- Filter by sitemap. Similar to the previous one, only the pages that we have manually indexed with a specific sitemap will appear.
Once we select an option we will have a graph with the indexed and unindexed pages of the website:
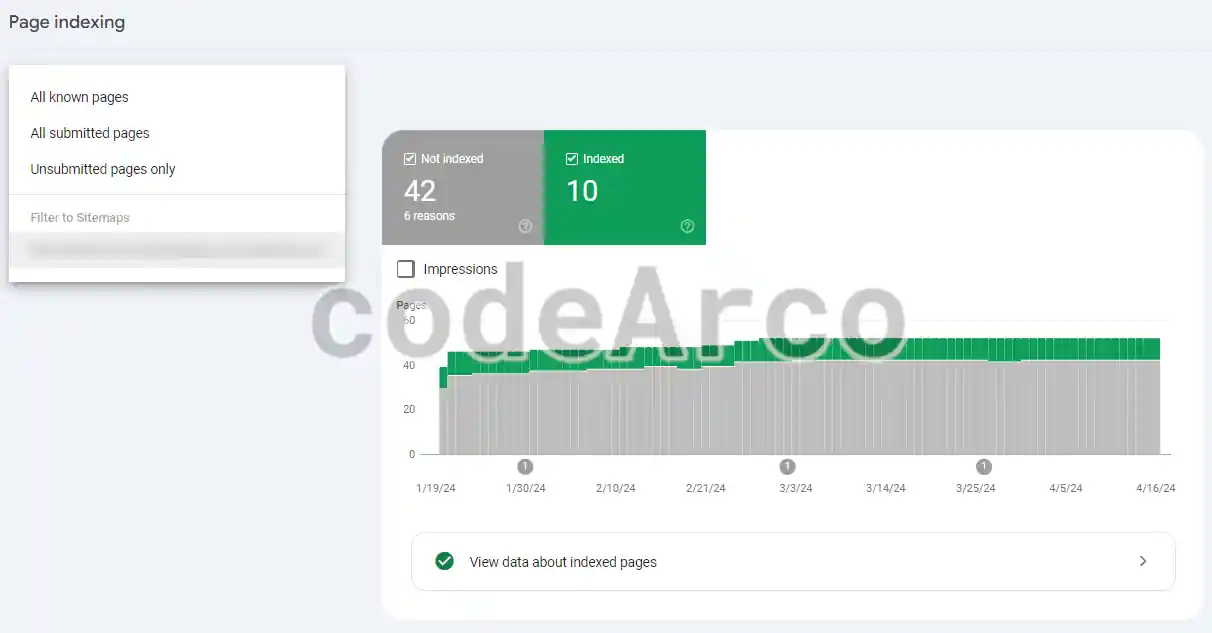
As we can see, two types of pages will appear, those that are and those that are not indexed. If we want to know the details we will access the table below.
At the bottom we have a table with the details of the indexing errors, this will allow us to know why a specific web page has not been indexed. Indexing errors in Google Search Console can be, among others:
- Alternate page with proper canonical tag. As we have mentioned, canonical urls allow search engines to be told that several pages are very similar and to choose one of them as the “original”, therefore, those that are not marked as original will be excluded from indexing and, consequently, this is not an indexing error.
- Page with redirect. Similar to the previous one, the difference is that this is a non-canonical url that redirects to another page that may or may not be indexed in Google.
- Discovered: currently not indexed. Google discovered the page but was not able to index it for some reason, such as the website being overloaded at the time.
- Crawled: currently not indexed. Google has crawled the page but has not indexed it. It will be indexed after a while, so it is not necessary to resubmit the sitemap.
- URL blocked by robots.txt. The web administrator, through the robots.txt file, has explicitly blocked the page.
- Submitted and indexed. The page has been submitted and indexed on Google. Most of the pages on your website should be in this section.
- Indexed, not submitted in the sitemap. Pages that we have not sent in the sitemap and that have been indexed because Google has discovered them through the automatic indexing of web spiders.
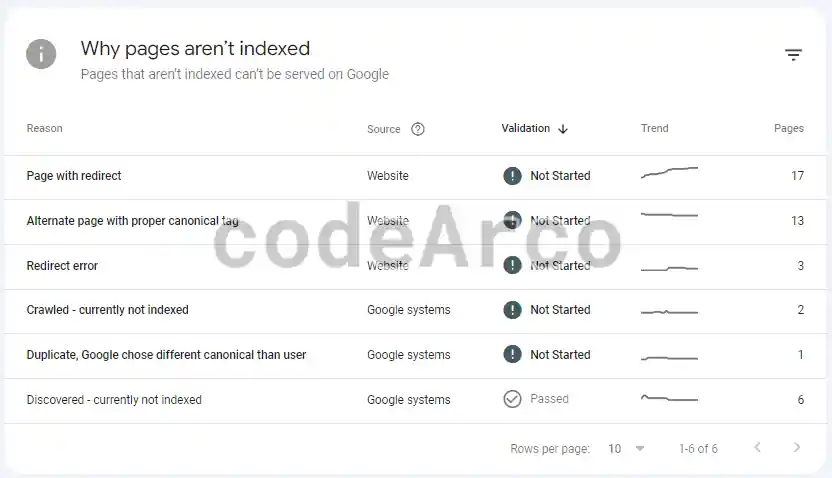
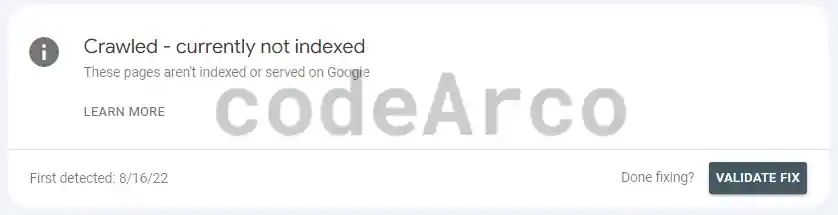
For the “Discovered: currently not indexed” and “Crawled: currently not indexed” errors, apart from waiting a reasonable amount of time, it is recommended to click on each row and, on the screen that appears, select “Validate fix”:
Sitemap and indexing in Google Search Console
The section sitemap of Google Search Console allows us to submit the sitemap of our website to Google (SEO Send sitemap) and check the status of the submitted sitemaps.
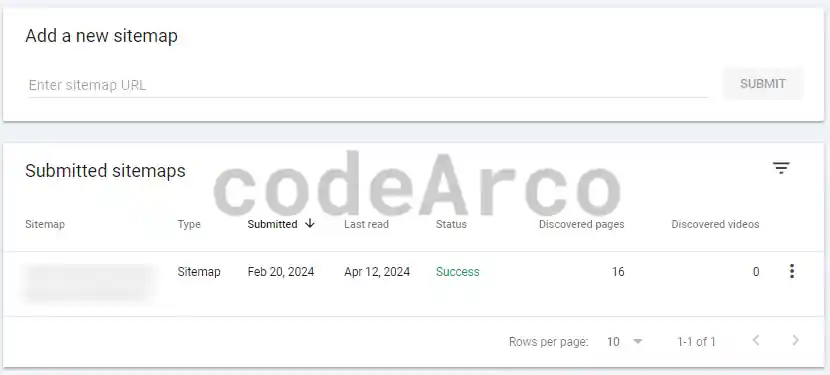
The Google sitemap and indexing section consists of two sections:
- Add a sitemap. It will allow us to submit the sitemap, that is, manually index all the pages of a website. We will only have to indicate the url of the sitemap and click on “Submit”.
- Submitted sitemaps. It allows us to know which sitemaps we have submitted to Google and their indexing status. Within this we have a table where we can check how many URLs have been discovered through that sitemap, the date of the last reading of the sitemap and, if we click on one of the rows, we will access the specific detail.
Regarding this section, we will not go into much detail in this Google Search Console course since you have more information in the previous link.
Remove or delete URLs from Google
The Google Search Console URL removals tool allows us to temporarily remove URLs from Google search.
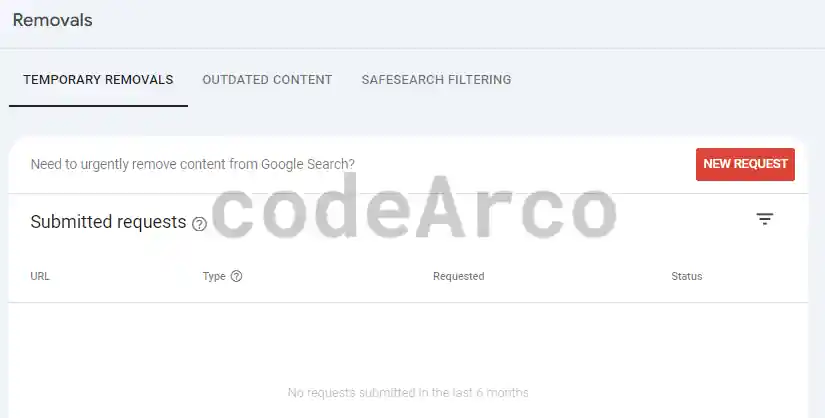
It is important to keep in mind that this tool, as Google comments, does not serve to permanently remove a URL.
If we want to permanently remove a URL from Google we have the following options:
- Delete the page directly from the website is the recommended method.
- Block access to the content through a login and password, this way Google will not be able to index the content.
- Use the noindex meta tag to indicate that the content should not be indexed in Google results.
- You should not use the robots.txt file to permanently remove a URL. This is because the robots.txt file prevents spiders from crawling certain pages so as not to overload the server in terms of traffic. But, for example, if we have an excluded page in the file and another external page has a link to the excluded page, it will appear in Google results.
The sections of the Google Search Console URL removals tool are quite simple:
- Temporary removals. Allows you to temporarily remove URLs and view the list of requests sent with their status. Within this section we have the option to temporarily remove URL, which allows you to remove a URL from Google for about 6 months, also deleting the cached copy and its fragment, and deleting the cached URL, which only deletes the fragment or thumbnail that appears in Google results until it is crawled again.
- Remove outdated content. The tool to remove outdated content allows us to remove content that has already been removed from the web but has not been removed from Google results. It is not necessary to be the owner of the website to make this request.
- Safesearch filtering. Google has the option “Activate safe search” which eliminates inappropriate content for, for example, minors from the results. Report inappropriate content requests allow you to mark a specific page as inappropriate so that it does not appear if the user has safe search activated. Again, you do not need to be the owner of the website to make this request.
Experience and Core Web Vitals
The page experience section of Google Search Console and Core Web vitals, in short, allows us to analyze the loading speed of our website, both for mobile device phones as well as computers.
If when you enter you do not have any graphs or data in Core Web Vitals and the text appears “Not enough usage data has been collected on this type of device in the last 90 days” you always have the alternative of analyzing the speed of your website with PageSpeed Insights and other tools as we explain in the linked article.
For this section, it is necessary to know the most important Google performance metrics:
- FCP or First Content Paint. Time elapsed from when the user visits the page until the first element is rendered, whether text, images, or other elements. Measured in milliseconds.
- FID or First Input Delay. Time elapsed from the user’s first action on the page (for example, a click on a button) until the browser responds to that action. It is generally measured in milliseconds.
- LCP or Largest Contentful Paint. Rendering time of the element with the greatest weight on the page. It is measured in milliseconds.
- CLS or Cumulative Layout Shift. How much, in a range of 0 to 1, the layout of the page changes as it loads. The lower the better, since if what we want is to have a good user experience, the page should not change its design drastically while loading.
- INP or Interaction to Next Paint. It measures the general response time of the page in all interactions that the user makes with the website, whether through keyboard or mouse. Measured in milliseconds.
- TTFB or Time to First Byte. Time from when the page is requested until the first byte is received, measured in milliseconds.
Based on the times obtained for each of the previous points, we can obtain the following comparative table of Google PageSpeed Insights metrics:
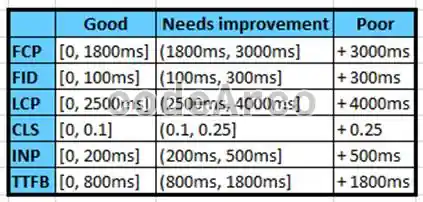
Additionally, we can see how the previous metrics interact and see how Google calculates the score of a website using the Lighthouse calculator.
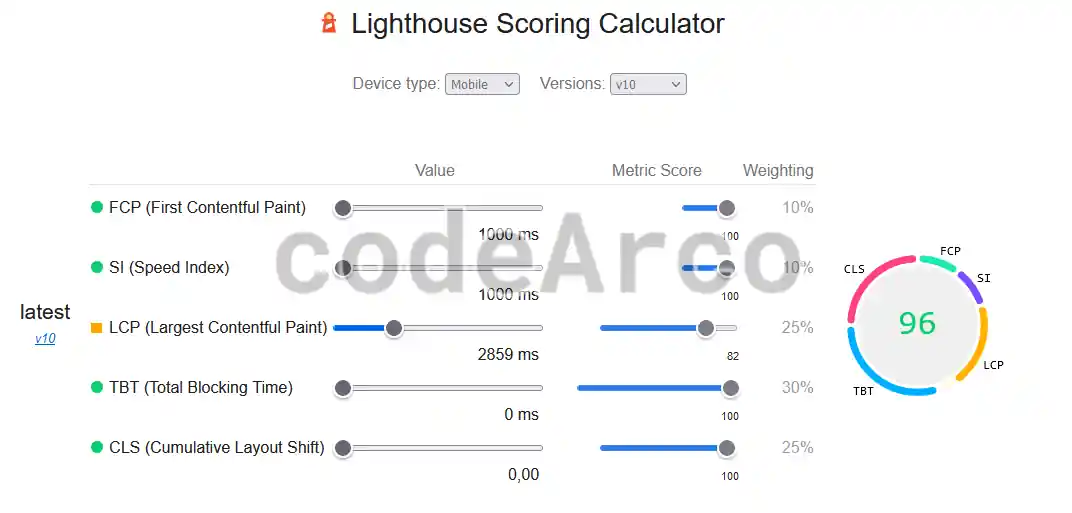
Having said the above, if what we want is to optimize the loading speed of a website and, therefore, improve our SEO positioning, we must first look at and fix the errors within the “Poor” category and, later, those that fall into the “Needs improvement” category.
Some recommendations to fix Google speed and performance errors are:
- FCP errors. Check your website’s waterfall to see what elements load and in what order. The improvements for this metric consist of only loading what is necessary at startup and the rest once the page has been rendered or loaded.
- FID errors. The first step is to identify what action or element takes time to respond, such as what button takes time to respond to the user’s click. Once identified, it will be necessary to analyze and alter the code corresponding to said action to make it more efficient. Requires knowledge of web development.
- LCP errors. To do this we have to identify which exact elements of the website have excessive weight and optimize them. If, for example, what is hindering the speed is an image, we can optimize the weight of the image with GIMP.
- CLS errors. Like the FID, it will be necessary to identify the code, plugins, themes… etc. that are drastically changing the design of the page and, after that and with knowledge of web development, avoid or minimize these drastic changes.
- INP errors. Given that it is the average response time for the entire website, we will have to do a general review. However, as a recommendation, we will start with those elements that have a longer response time since their impact, on average, is greater.
- TTFB errors. A solution to improve time to first byte is to use CDN so that the content is served close to the user’s location.
HTTPS in Google Search Console
The HTTPS section of Google Search Console allows us to see HTTPS errors in a similar way to the indexing of pages sent through the sitemap as we saw in previous sections of this Google Search Console tutorial.
On the one hand we find a graph where we can see the urls that are not https versus those that are:
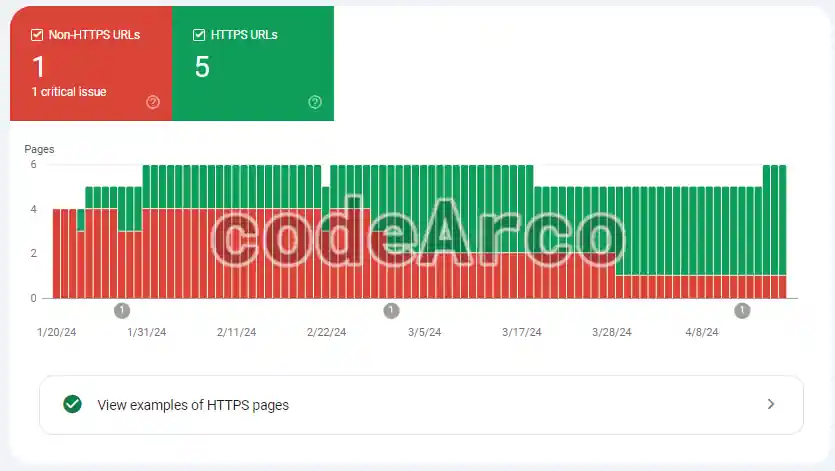
The most interesting thing in this section is the table below that shows us why there are HTTPS errors in Google Search Console:
- Sitemap points to HTTP. It is the most common error, check the sitemap, surely the urls it contains are HTTP instead of HTTPS. Once edited, send it back to Google and Bing and the errors will disappear.
- HTTP marked with canonical tag, as in the page indexing section, is simply telling us that the page marked as canonical (that is, as original) is HTTP and should be HTTPS. Check the <link rel=”canonical”> tag.
- HTTPS not evaluated. This error can be caused by many others, such as, for example, that an HTTP page does not have a corresponding HTTPS, Google has found many other errors and has stopped processing the pages of your site, or that both versions (HTTP and HTTPS) exist but, for some reason, Google has chosen the HTTP version as canonical.
Once we have resolved the errors, in an identical manner as we did when indexing pages, we can request “Validate fix”.
SEO penalties and manual actions
The option of manual actions and SEO penalties allows us to see if manual actions have been carried out on our website but… What are manual actions in Google Search Console?
Basically they are actions that try to avoid fraudulent SEO techniques, that is, they are SEO penalties applied to a website after a review by a human being, as indicated in the manual actions documentation.
Some reasons why Google penalizes SEO of our website are:
- Automatically generated content, that is, content generated by a robot or program and not by a human.
- Participation in link schemes, that is, agreements to link sites to each other without this providing any benefit to the user, which is only intended to improve the SEO Off Page of our website.
- Hidden text or links. For example, text that is added only to improve positioning but is hidden through CSS.
- Duplicate content. Let us remember that copying content from other web pages is severely penalized by Google at the SEO level.
- Use irrelevant keywords, that is, they have nothing to do with the context in which they are found.
Therefore, it is better that in this section you see the message “No problem has been detected” and, if not, review the reason and correct it as soon as possible as it may penalize your SEO positioning.
Security issues
The Google Search Console security issue report lets us know if there are security issues on our website.
As the documentation on security issues indicates, these can be divided into three categories:
- Hacked content, that is, malicious actions against our website that have been carried out without our permission by exploiting vulnerabilities.
- Malicious software and unwanted software, that is, existence on our website of malicious software aimed at causing harm to the users of our website and their devices. This software may be present either because the site administrator has installed it intentionally or because a hacker has installed it without our permission.
- Social engineering. A very interesting aspect of web security is social engineering, which basically allows you to obtain confidential or sensitive information by deceiving users.
As before, it is better that the report shows “No issues detected” and, if not, you should investigate the reason and origin of the problem.
Some specific security problems that we can find in the report are:
- Hacked: code injection. For example, a hacker has injected code into your website and it is mining cryptocurrency without your permission.
- Deceptive pages. The website contains pages that attempt to trick the user into, for example, providing confidential information.
- Links to harmful downloads. The website contains downloads that Google Safe Browsing considers dangerous.
Legacy tools and reports from Google Search Console
The legacy tools and reports section has several sections that are not incorporated into the tool in an “official” way but can be accessed through from the menu link. You may not have the same sections that we describe in this Google Search Console course because they have already been integrated into the tool or they have been discarded and no longer exist.
Keep in mind that they can only be accessed from sites that are not domain property. You can check this in the upper left, selecting the domain properties drop-down menu.
The legacy tools and reports sections of Google Search Console are:
- International segmentation. It allows you to know and debug the status of international SEO, very useful for when you have a multilingual website with hreflang tags among others.
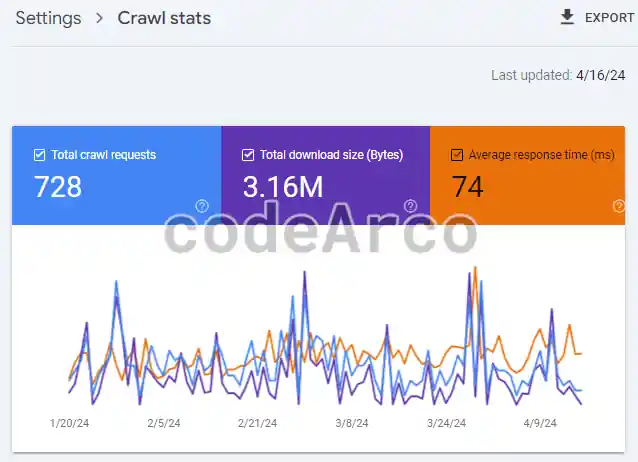
- Crawl stats. Basically it allows us to know how frequently Google crawls our website and the number of requests it makes.

Old reports crawl stats Google Search Console - Messages. Messages sent to our properties before May 23, 2019. Subsequent messages are already integrated into the tool through the bell icon in the upper right.
- URL parameters. The parameters in a URL are those that come after “?”, for example, “www.mySite.com?language=en”. This tool allows you to inform Google of the parameters of our website that cause important changes in the content of the page, such as language.
- WebTools. WebTools are a set of tools and reports, such as the Ad Experience Report.
Links report
The Google Search Console link report allows you to know the information on all the links on a website. This report is key if you want to improve the SEO Off Page of your website.
Before proceeding to view the report, it is necessary to be clear about the difference between external link and internal link:
- An external link is one that is on a website that is not ours and points to our website.
- An internal link is one that is on our website and points to a page on our own website.
The Google Search Console links tool consists of the following sections:
- Most linked pages from external links. List of pages on our website with the most external links. If we click on one of the rows we can see where exactly we are linked from, both the domains and the specific pages.
- Websites with the most links. Domains that link the most to our website. If we click on the details we can see the specific pages from which they link to us.
- Most frequent link text. Also known as anchor text, very important for SEO Off Page. The words with which we are linked, among other things, must be well-chosen keywords that have to do with the linked content.
- Pages most linked from internal links. List of pages on our website with the most internal links. If we click on one of the rows we can see which specific page of our site the link is located on.