
Speed and performance are critical for SEO, they can make a big difference when it comes to being correctly positioned in search engines. Before knowing how to improve the loading speed of a website, it is necessary to know the techniques, tools and metrics to check web speed and performance.
On the Internet there are many tools to check the loading speed of a website and its performance, among which we will see:
- WebPageTest. Tool that has a graph known as Waterfall that will allow us to graphically see the loading order of the web elements as well as their loading time, speed and performance.
- Google Search Console. Tool that has a series of metrics to evaluate web performance.
- Google PageSpeed Insights. Similar to the previous one, it allows us to check the speed of a website based on a series of graphs and metrics.
WebPageTest and speed metrics
WebPageTest is a free website that allows us to check the speed and performance of a website.
The first thing we must do is enter the address of the page, the location and the browser with which we want to perform the test. We click on “Start Test” and wait a few seconds.
Next, a page with a lot of information will appear. Since they are advanced concepts, we will not look at all of them and focus on a few.
In the header we have a summary of the results:
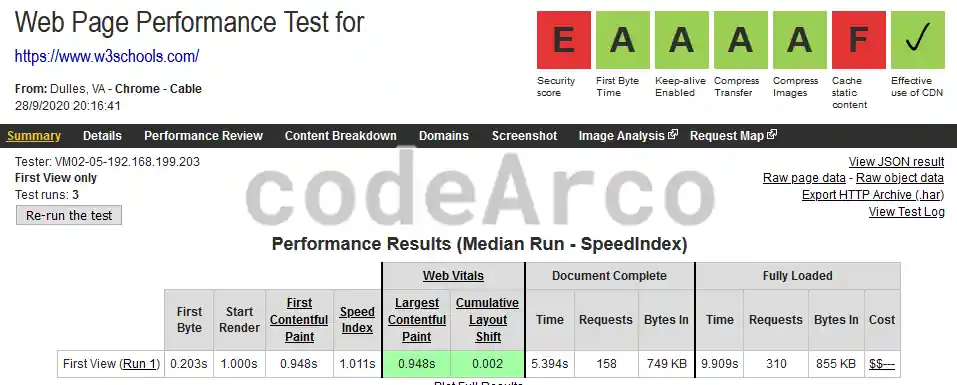
The top right is a summary of the website’s score on the key aspects of performance and speed. Anything that does not have the value A or B, we should investigate what exactly it refers to and try to solve the problem.
Two tables appear below. Of them we are going to look at two specific values, “Start Render” and “Document Complete”, we will talk about them later.
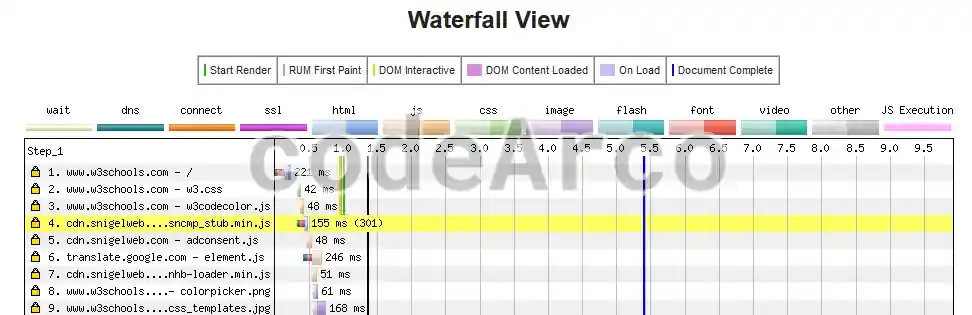
Next we have the “Waterfall web” which shows us all the elements of the web page that are loaded, the time and order of said loads.
DNS domain name resolution
The first Waterfall record is important, it indicates the domain name resolution time. This is also known as DNS resolution and indicates the time elapsed from when the browser requests the IP address corresponding to the name of the website until it receives it. If the DNS resolution time is excessive, it may be due to two reasons, among others:
- That the DNS requester is far from the DNS server that does the domain name resolution.
- That the domain and hosting have been contracted to different companies, which results in the need for communication between them, which increases time.
Waterfall web performance analysis
Other important aspects or metrics of the Waterfall web, as we have mentioned before, are the Start Render (green line) and the Document Complete (blue line).
The Start Render indicates the time in which the web page begins to be painted, it should not be more than 2-3 seconds.
Document Complete is the time in which, practically, the website is loaded in its entirety (although afterwards, as you can see, things that are not too important continue to be loaded).
Other sections of WebPageTest
Apart from what was mentioned above, it is advisable that you take a look at the different sections of WebPageTest as they are quite interesting. As a summary, we have the following:
- Details. It is the Waterfall with a higher level of detail.
- Performance Review or performance analysis. List with all the elements of the Waterfall web but with data different from the previous ones, such as, for example, whether or not a CDN has been detected.
- Content breakdown or content breakdown by MIME type. Basically it is a Waterfall divided by MIME content type such as html, css, js or images.
- Content breakdown by domain. The same as above but the content of the Waterfall is divided by domain.
- Image Analysis. It allows us to check the loading speed of the images that are on the analyzed page.
- Request Map or connection map. It allows you to see a map of the requests that the website makes.
Google Search Console web metrics
Google Search Console is a tool to check the loading speed of a website and its respective performance for both mobile phones and computers that we have already seen on multiple occasions for other purposes such as, for example, submit the sitemap of a website to Google.
Before starting, it is necessary to check that you have the Google Search Console property configured to be able to follow all the steps.
After logging in to Google Search Console we will go to the side panel, Experience, Core Web Vitals. If at this point no graph or data appears and the text “Not enough usage data in the last 90 days for this device type” appears, it means that you will have to wait a while until Google collects more data from your website and, therefore, you will have to use the rest of the alternatives to check the web loading speed and performance of this article.
Speed Metrics in Google Search Console
Before proceeding to analyze the speed data and graphs, you need to know the following speed metrics in Google Search Console:
- LCP or Largest Contentful Paint. Time it takes to render or paint the heaviest element on the page, measured in milliseconds.
- FID or First Input Delay. Time that passes from the user’s first action with the website (such as scrolling vertically) until the browser responds (that is, the website scrolls vertically). It is generally measured in milliseconds.
- CLS or Cumulative Layout Shift. It measures the level of change in the design of the page from the moment we enter it until it finishes loading, measured in a range from 0 to 1. The lower the value the better, therefore, if what we want to achieve is that the user experience (UX) is good, the layout of the page should not change drastically while it is loading.
- FCP or First Content Paint, time it takes to paint the first element of the web, measured in milliseconds.
- INP or Interaction to Next Paint, average response time of all user actions on the entire web page, also measured in milliseconds.
- TTFB or Time to First Byte, time elapsed from when the user accesses the website until the first byte is received, in milliseconds.
Some of these metrics are also used, as we will see later, in PageSpeed Insights.
Google PageSpeed Insights and metrics
Another good tool to check the speed of your website is Google PageSpeed Insights. It has a series of metrics that will help us analyze the performance of a website.
Unlike Google Search Console, this tool allows us to check the speed of any website and its performance, it does not have to be ours.
Once the url has been entered and, after pressing the analyze button, we will see two sections, the computer section and the mobile device section. The mobile device section is very useful for web compatibility with mobile devices or mobile friendly.
Metrics and charts in Google PageSpeed Insights
After choosing one of the previous options, the first thing we see is a general score as well as the color legend. The Google PageSpeed Insights score is divided into slow (0-49), normal (50-89), and fast (90-100).
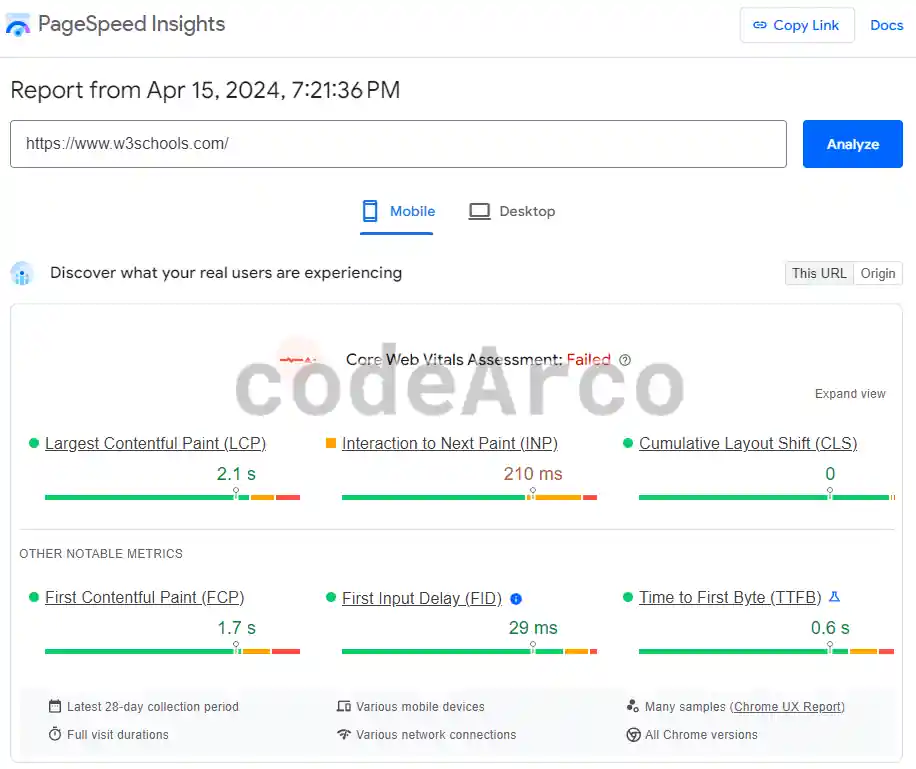
Before continuing, it is necessary to know the difference between “This url” and “Origin”:
- This url. These are the data and metrics collected during the previous 28 days only from the page analyzed. That is, they are real traffic metrics for 28 days, not just from the moment the test is launched.
- Origin. It is the same as the previous one, that is, performance and speed metrics and data, but for the entire domain, not just the analyzed page.
Another interesting part of this tool is that we can expand information by clicking on the expand view button of Google PageSpeed Insight.
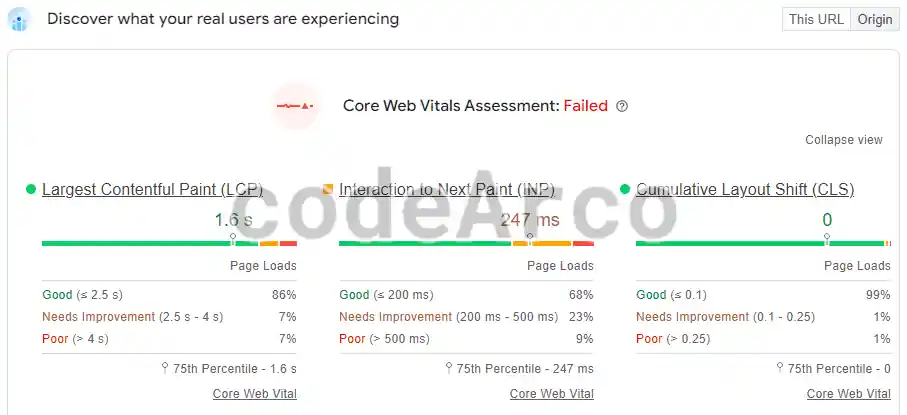
As you can see in these color bars we have values in time and percentages. It must be taken into account that this data is accumulated, that is, data from real user experiences collected over time.
The percentages indicate how good or bad the user experience has been in that specific metric over 28 days. Following the example in the image, 86% of the values observed over 28 days are good, 7% need improvement and 7% are bad. In other words, the LCP for 86 out of every 100 users has been good, for 7 out of every 100 users it has been average and for 7 out of every 100 users it has been bad.
Regarding time, it indicates the 75th percentile of the LCP which we could consider as the optimal value.
Diagnose performance issues with Google PageSpeed Insights
Finally we come to one of the most interesting sections of Google PageSpeed Insights, the performance diagnosis. This, in turn, is divided into 4 categories:
- Performance. Issues that have to do with the speed and loading times of the website such as, for example, the FCP or CLS.
- Accessibility. Issues related to accessibility, such as the alt attribute in images.
- Best practices. Several recommendations such as, for example, that the lang attribute of the html element has a correct value or that the page has a title element.
- SEO. SEO recommendations and tips such as, for example, that the links have descriptive text.

As you can see, PageSpeed Insight is not only used to check web speed and performance, it also allows us to obtain very interesting SEO recommendations and tips.
Finally, if you want to learn more about the metrics, recommendations and tips of Google PageSpeed Insight, you can check the link for more information.