
In this post we will get down to work and see the practical course Google Analytics 4. To do this we will need, as we already mentioned in previous sections, to use the GA4 test or demo accounts to access all the graphs, reports and analysis of the tool.
Reports in Google Analytics 4
In the Google Analytics 4 reports section we find the following sections:
- Reports snapshot. Set of the most important or generic reports.
It should be noted that all cards have a link below that will allow us to access expanded information.
We can also modify the date range, metrics and/or dimensions:

Metrics and dimensions Google Analytics 4 
Reports snapshot Google Analytics 4 - Acquisition reports. They provide generic information about users, such as geographic location, where users come from (organic search, ads, etc) or how these users interact with our website or app.

Acquisition reports Google Analytics 4 - Real time reports. Realtime information on the activity of our website and/or application. The events displayed are those that occur a maximum of 30 minutes and a minimum of 5 seconds ago.

Real time reports Google Analytics 4 - Traffic reports. Number of users and their place of origin.

Traffic reports Google Analytics 4 - Engagement reports. How users interact with our page or application, this is where we can see information about events.

Engagement reports Google Analytics 4 - Monetization reports. Customer purchasing habits with our website or application.
- Retention reports. Information about recurring users, that is, those who visit our app or website again.
- Reports on demographic data or user attributes. Demographic and geographic information of users, such as country of origin, interests or age. Interesting from the point of view of International SEO.

Demographics data Google Analytics 4 - Tech reports. User information from a technological point of view, such as the browser they use or type of device. It will be of great help to us when analyzing and creating a mobile friendly website.
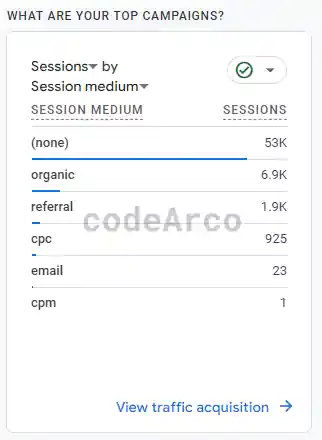
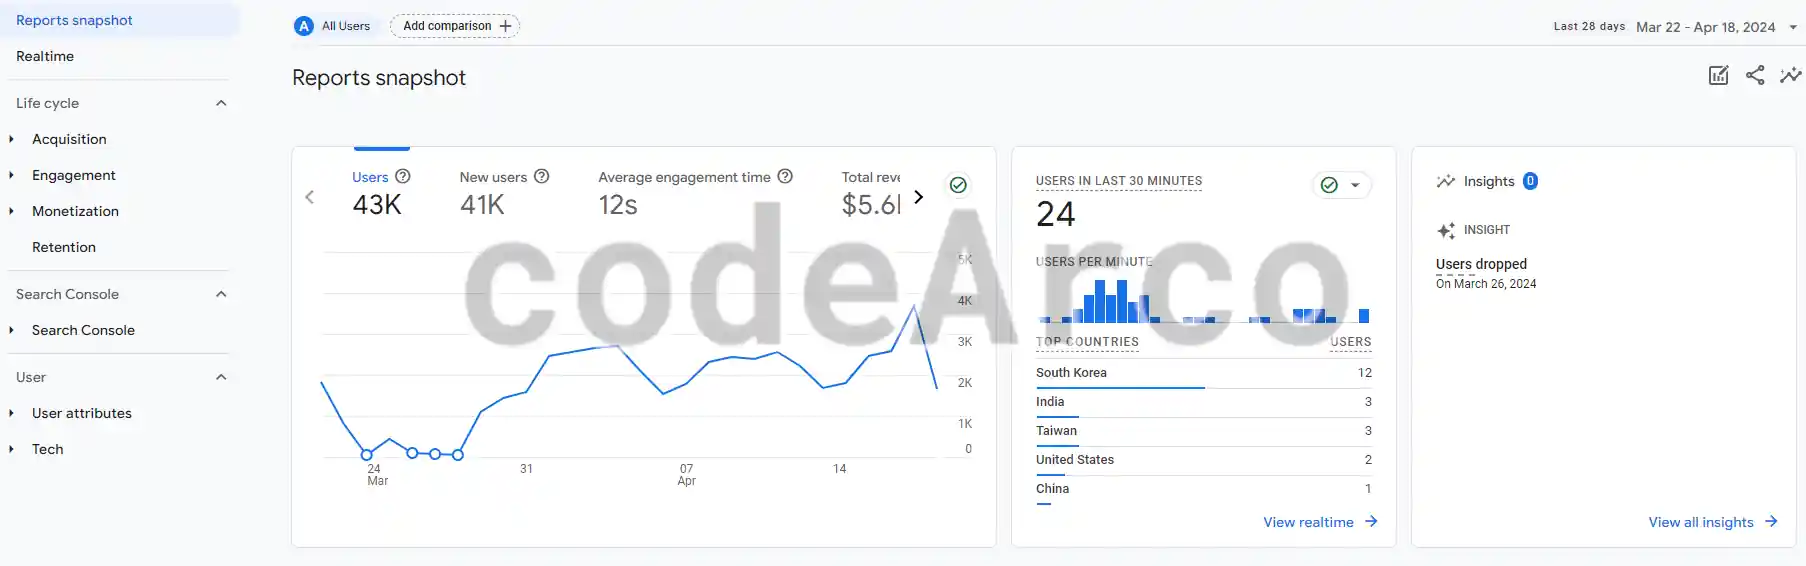
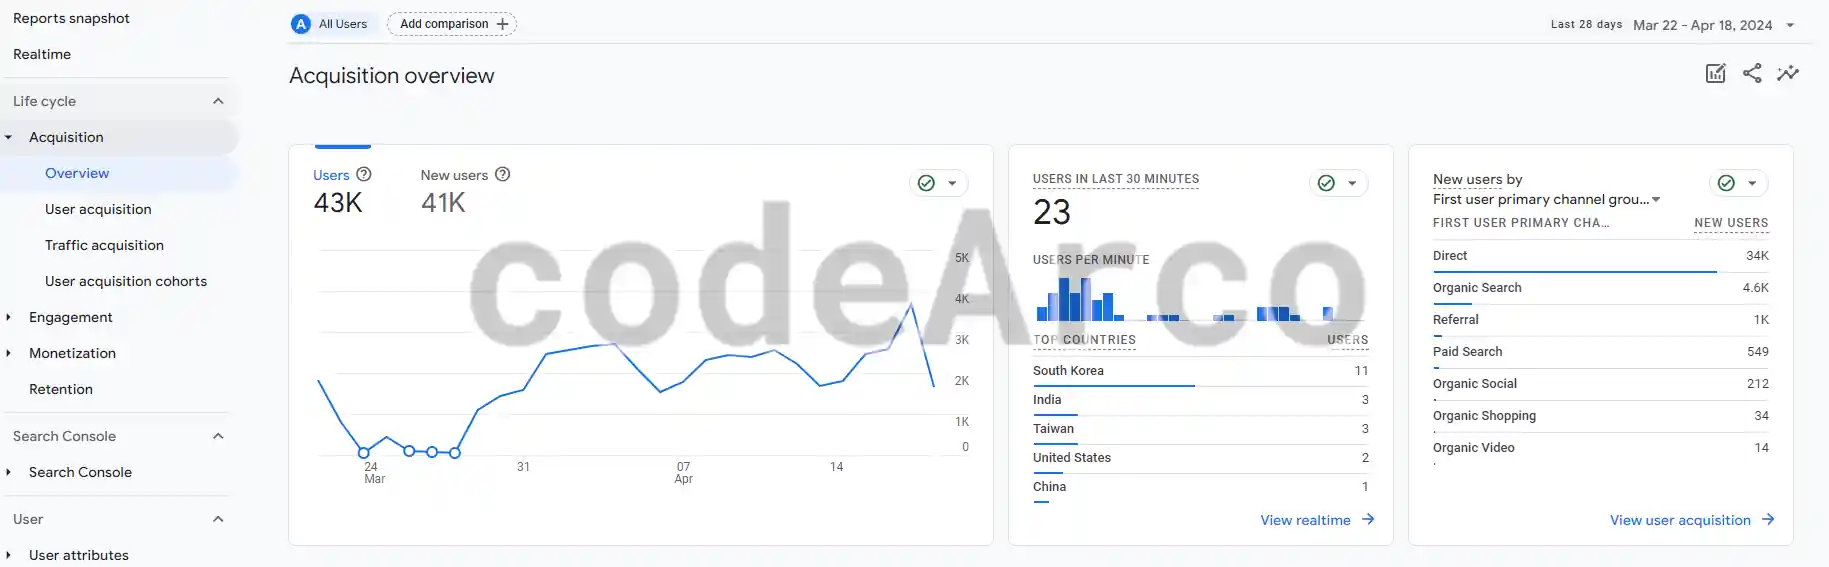
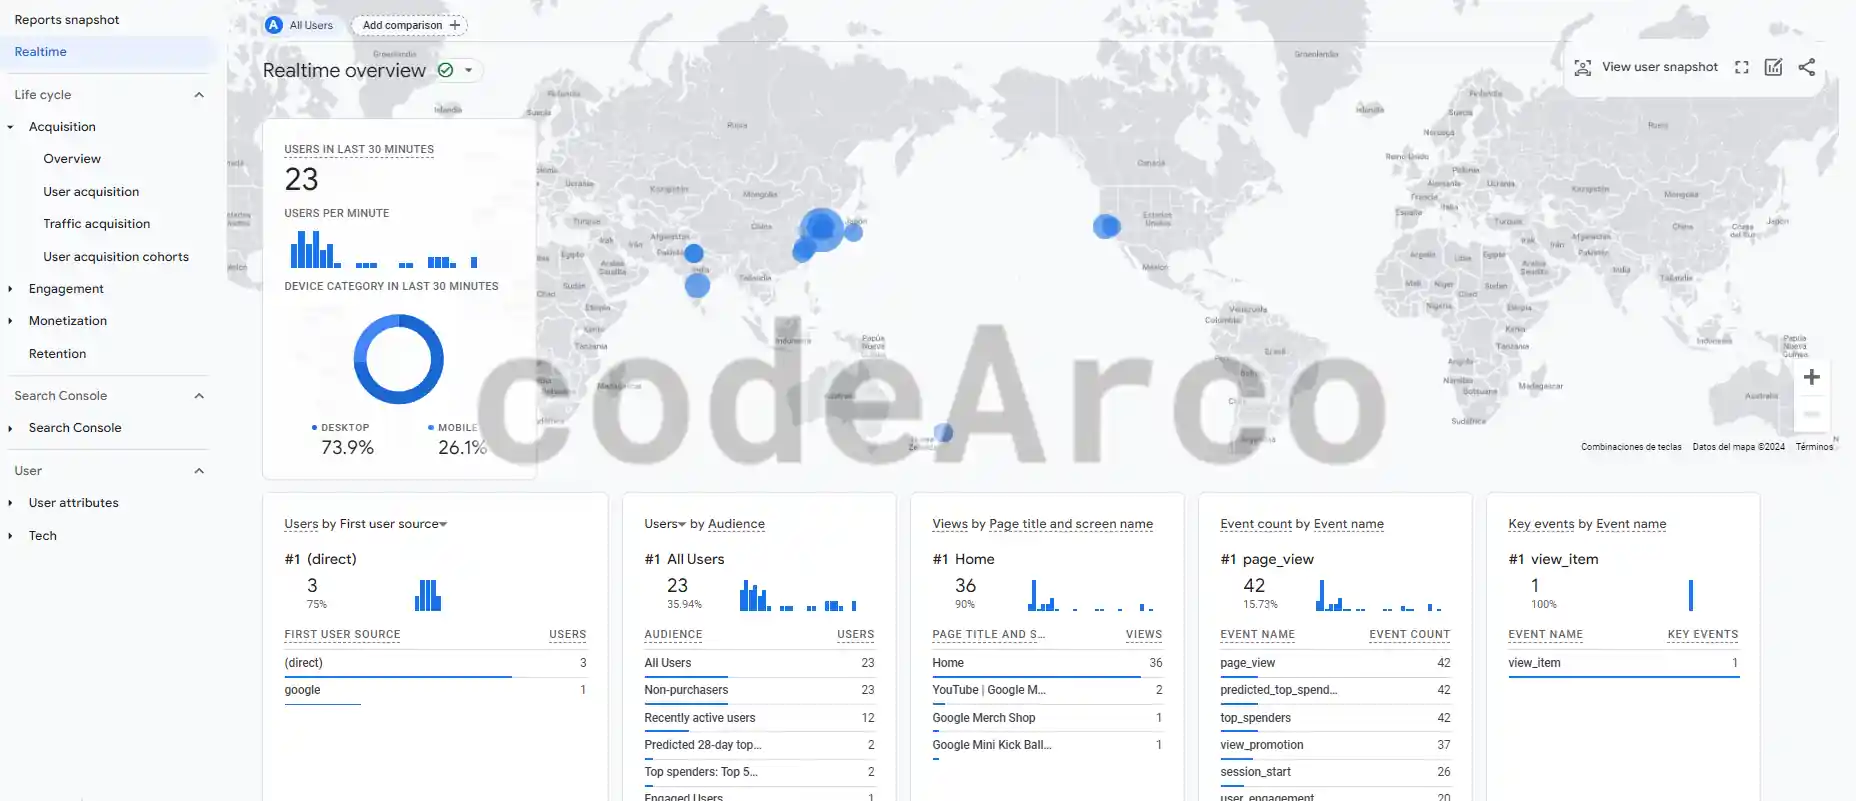
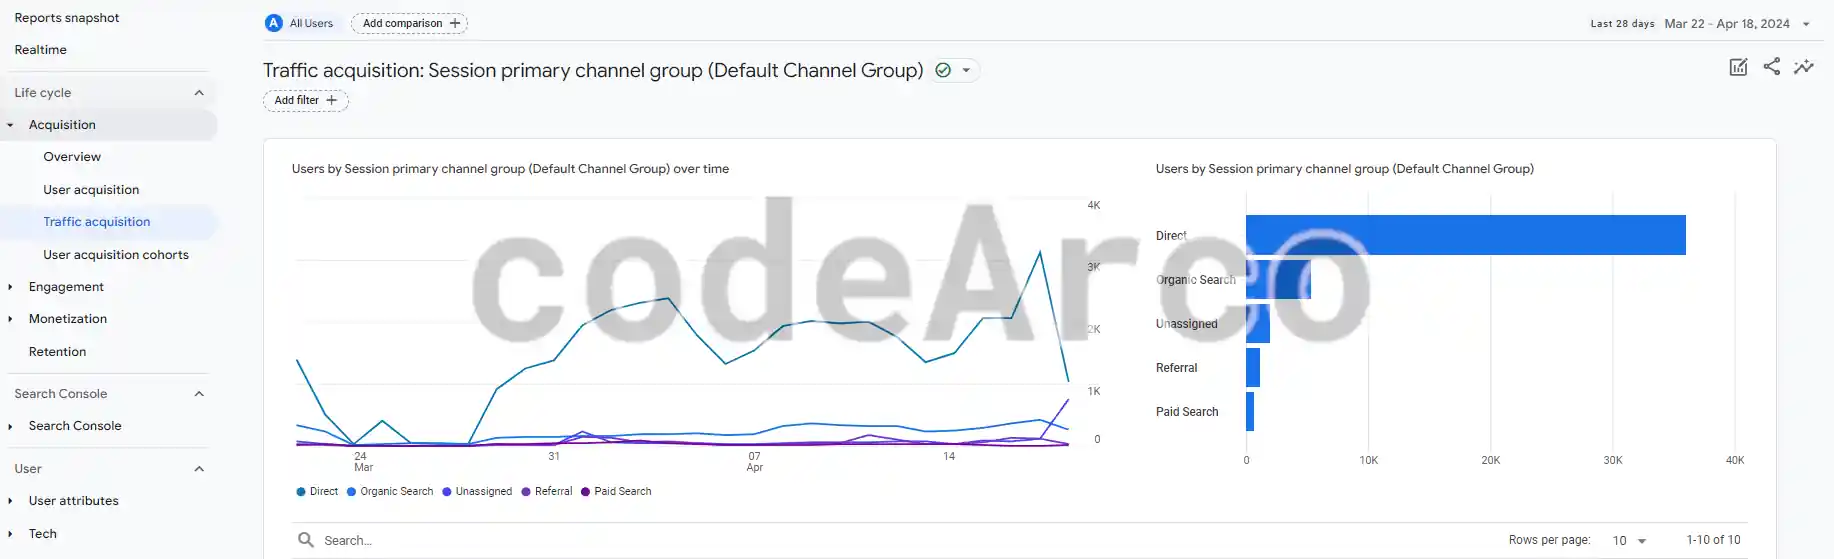
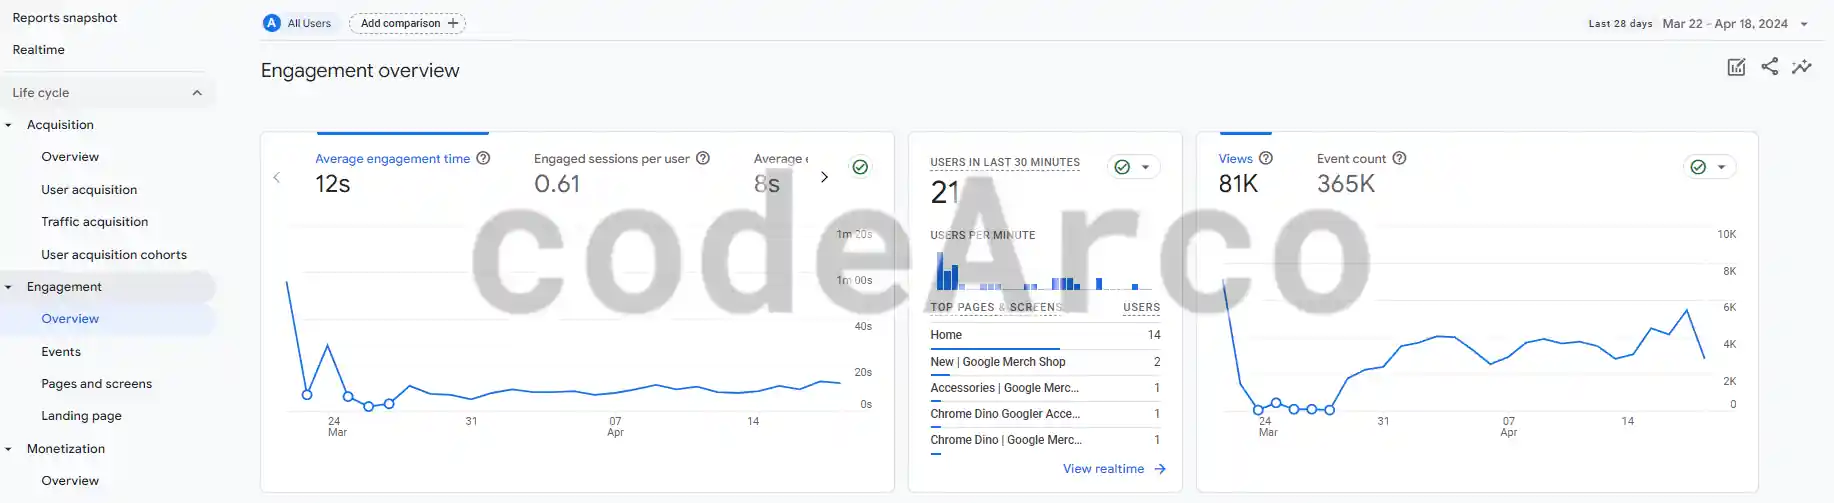
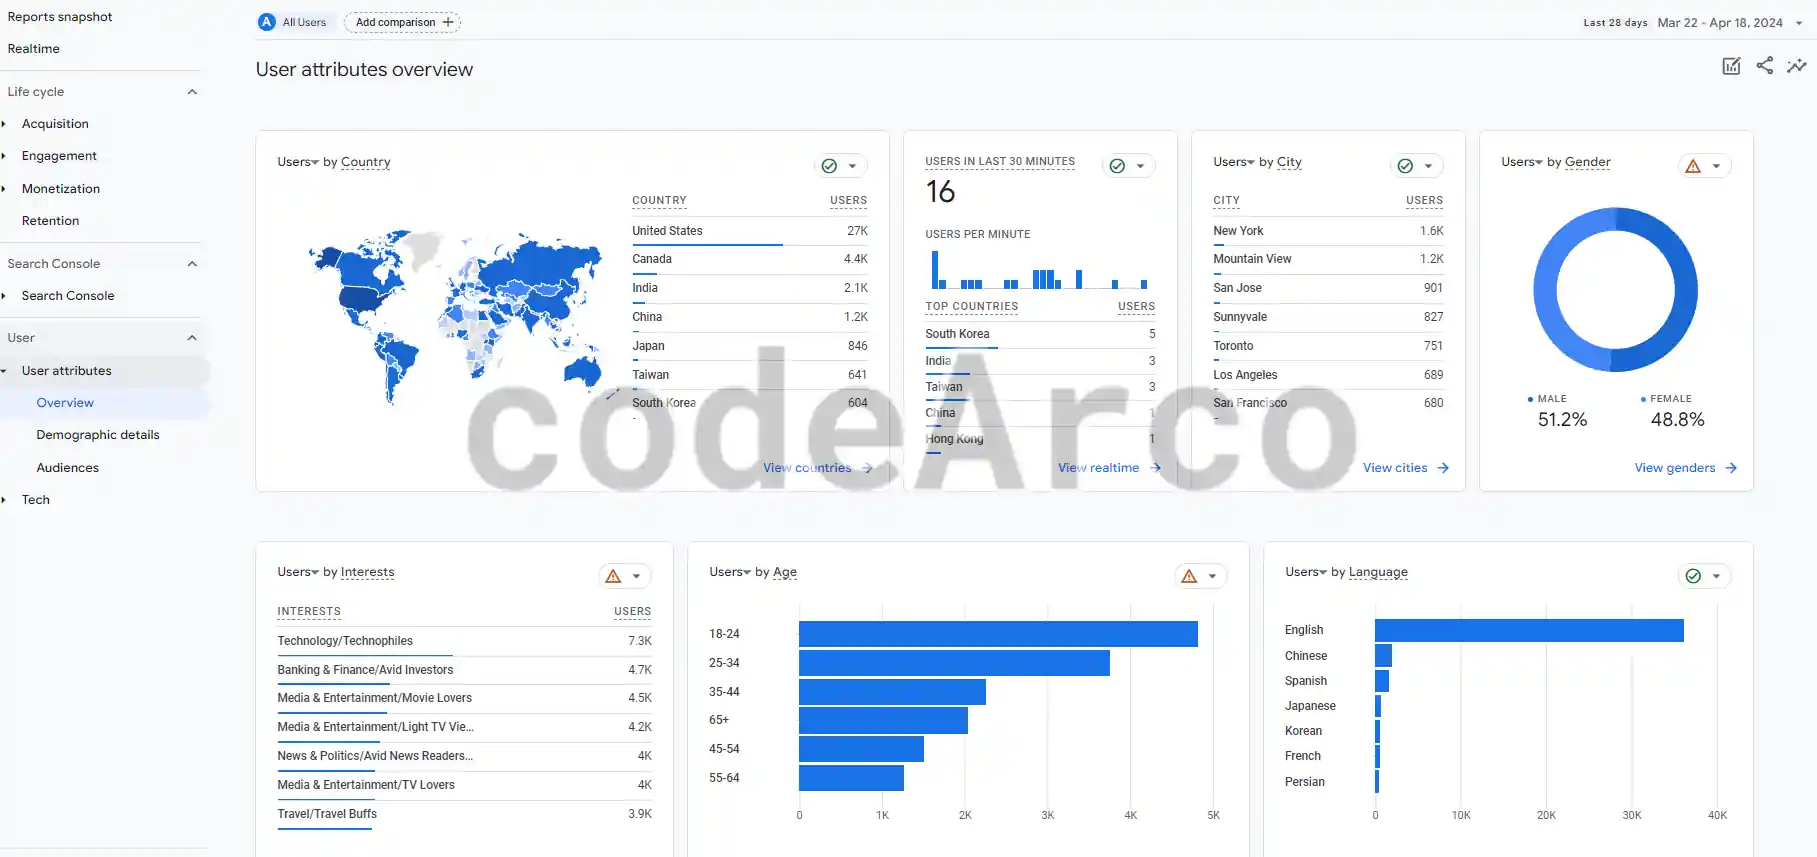
For each of the previous graphs we have expanded information screens where we can see the data expanded and in more detail in graph and table format. We also have filters, date ranges, share reports, etc:
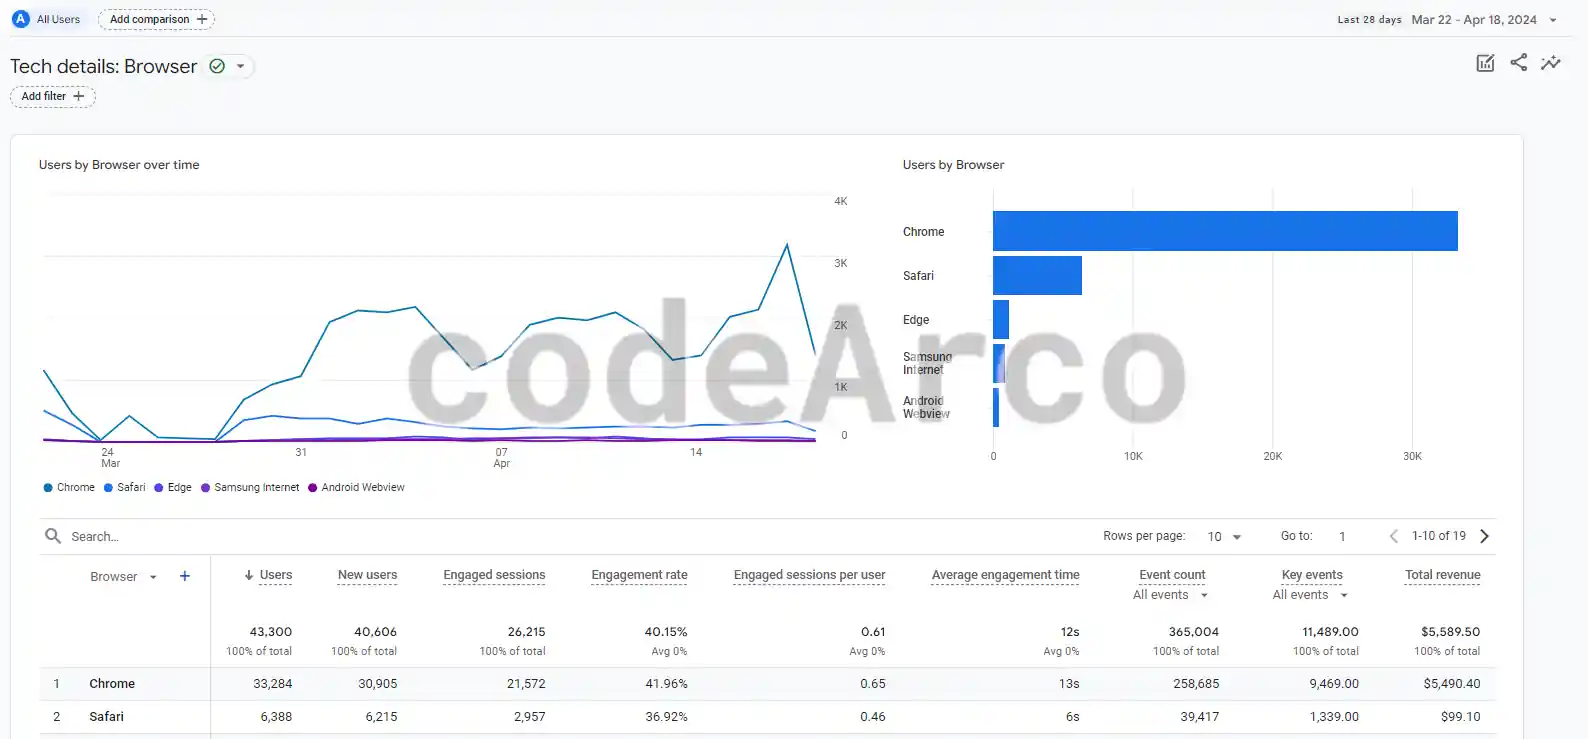
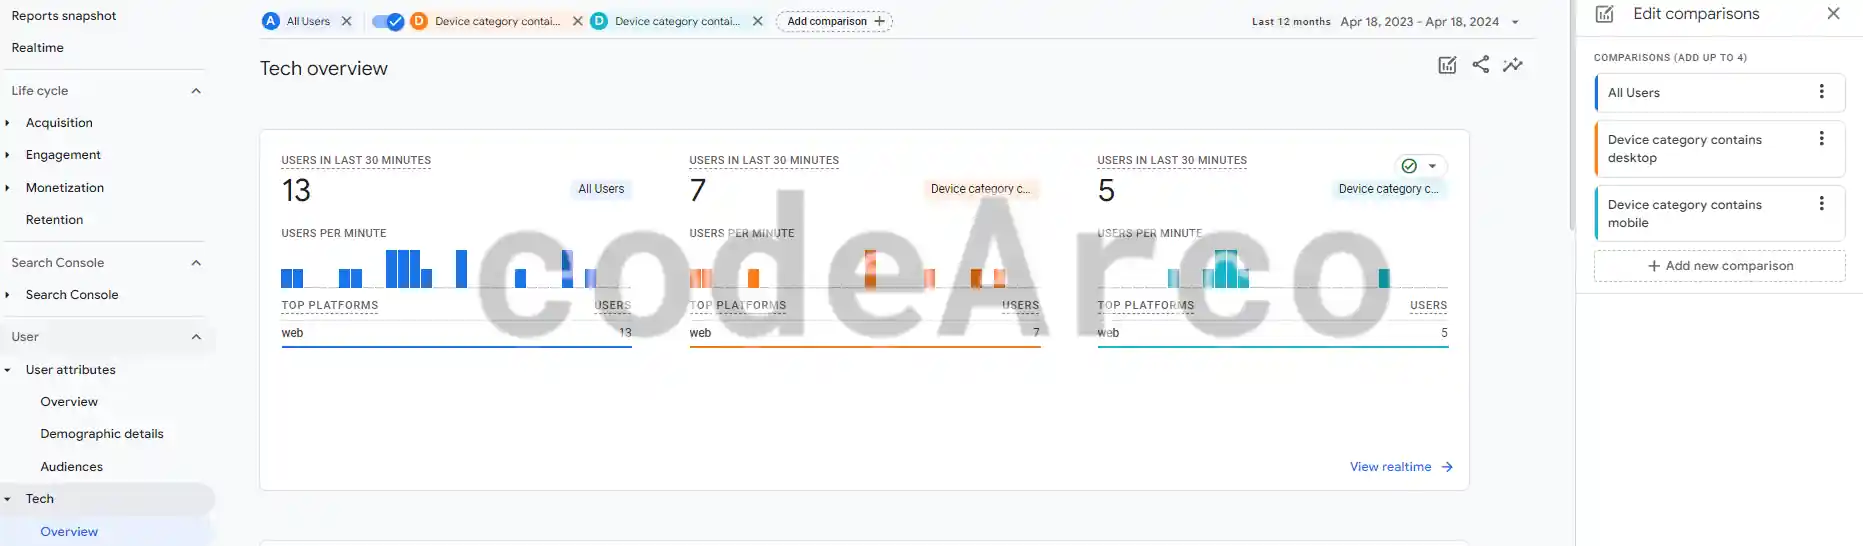
Another interesting section within this Google Analytics 4 course are the comparisons that allow us to compare all the data based on the dimensions that we establish. For example, we can see the information in the technology section for all users, users who access by mobile and users who access by desktop:
Explorations in Google Analytics 4
The differences between Google Analytics 4 reports and explorations are:
- The reports are predefined, general and focused on a metric of our business and we can modify them superficially.
- Explorations allow us to create fully customized reports, go much deeper into our data, and use the chart format, metrics, and audiences we need.
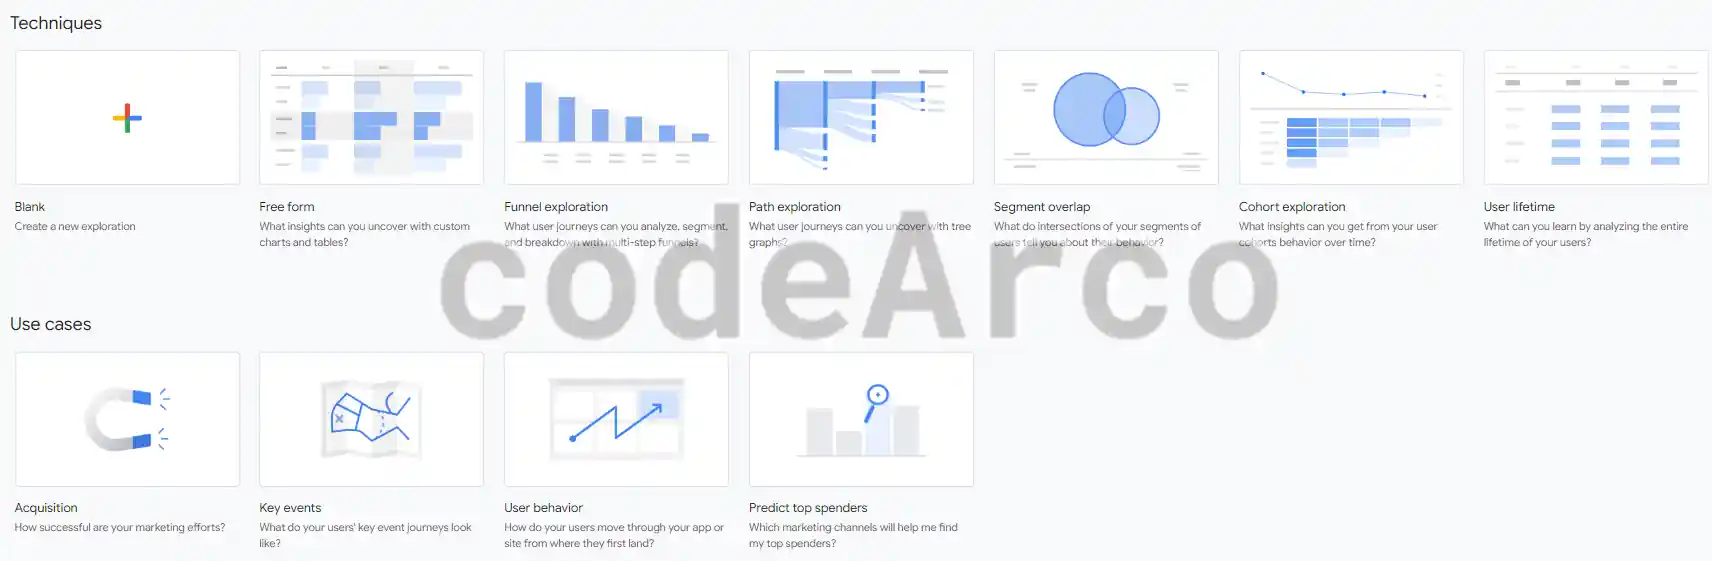
We have the following types of explorations:
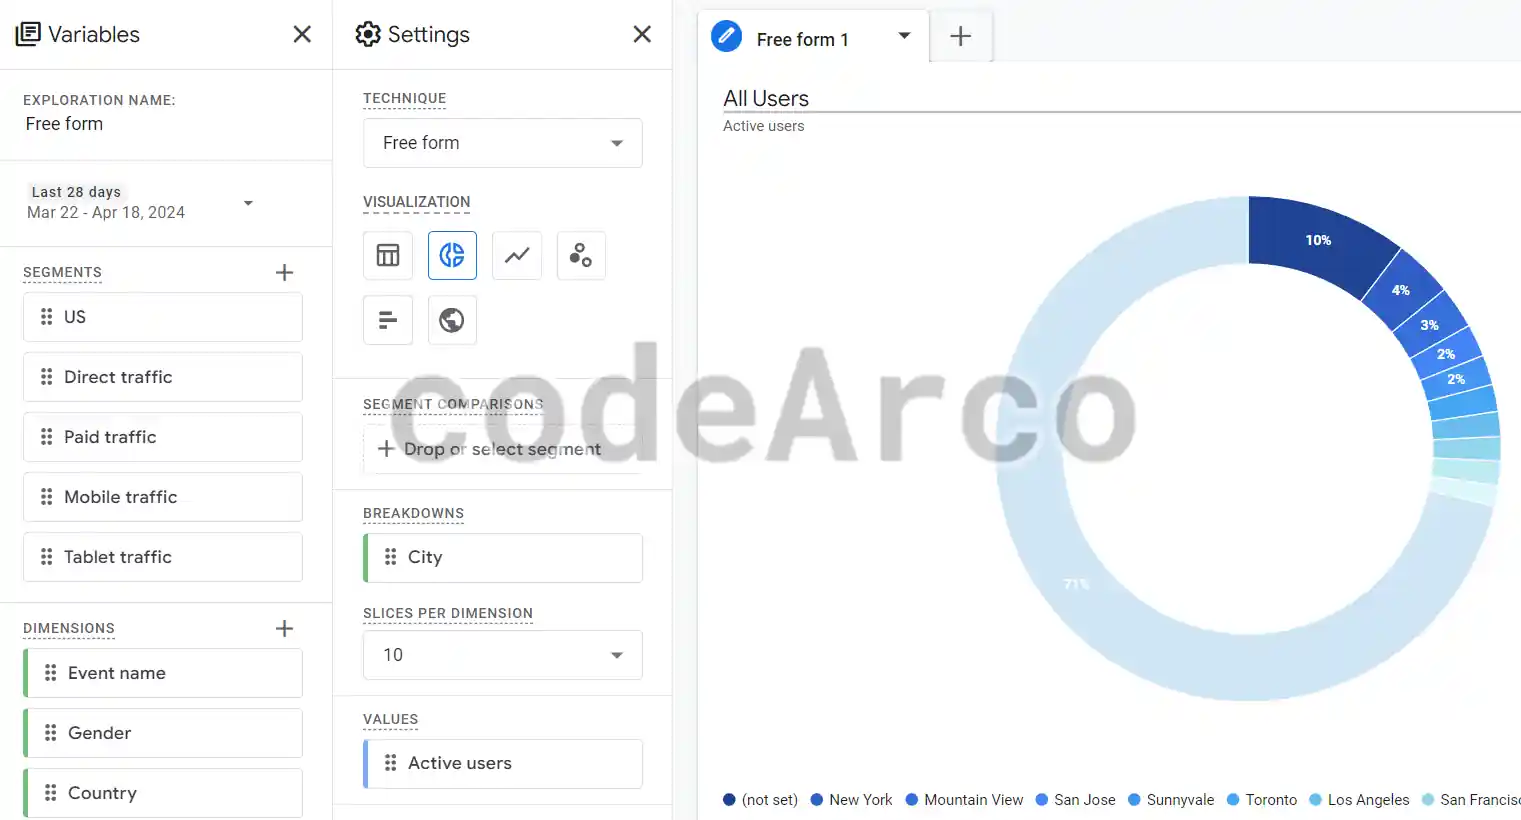
- Free form exploration. Report focused on customization, allows various types of graphs with different variables and metrics.
For example, we can create an exploration of United States users with a donut chart that allows us to see which specific country in United States they come from:

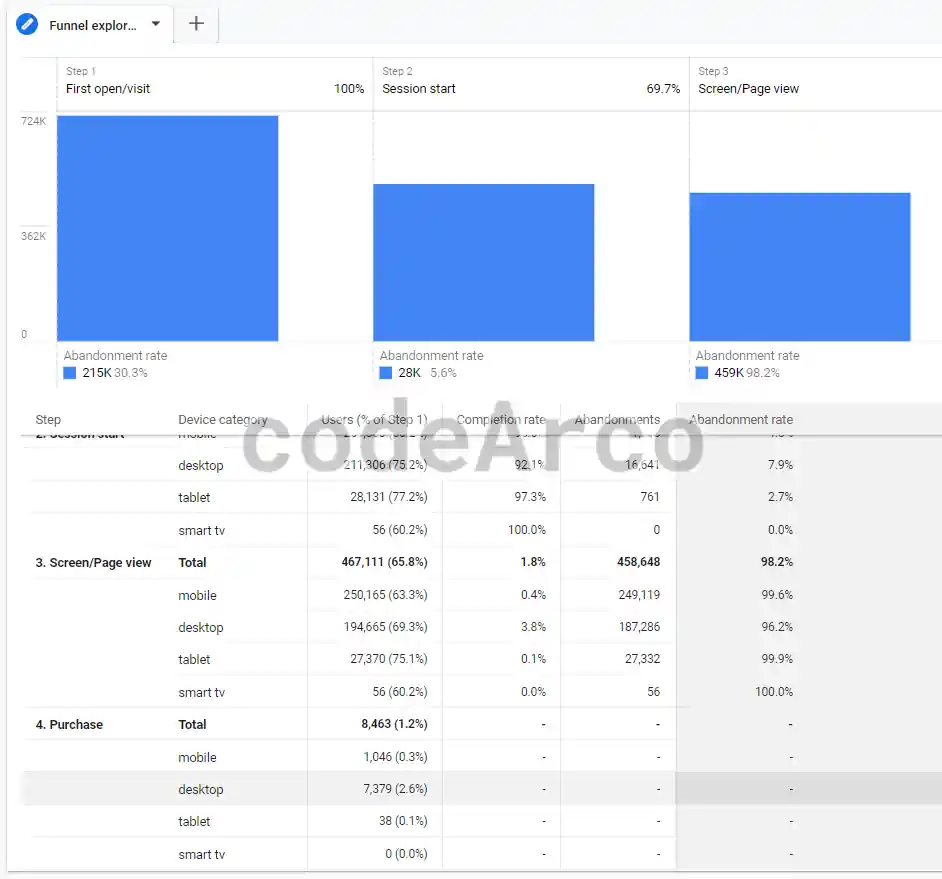
Free form exploration Google Analytics 4 - Funnel exploration conversion. Report focused on the steps that the user follows through our website or application to carry out important actions (conversions) that interest us, such as, for example, a purchase.
For example, from the following exploration we can obtain the information that most purchases are made by computer, not by mobile phone or tablet:

Funnel exploration conversion Google Analytics 4 - Path exploration. Similar to funnels, the difference between conversion funnels and paths explorations in Google Analytics 4 is that paths exploration are a more open concept, they allow us to know the user steps towards an important action even if we do not know or do not have that route defined and conversion funnels are a more limited and defined concept.
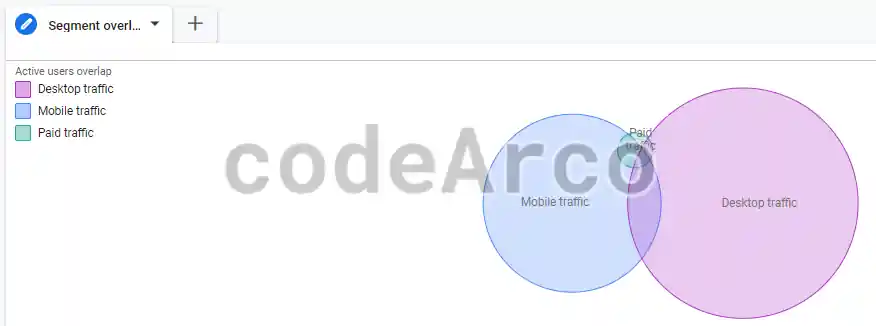
- Segment overlap. Segments in Google Analytics 4 are similar to audiences, that is, a group of users with common characteristics. Overlapping segments means analyzing the relationship that users with different characteristics have with each other.
For example, we can overlay mobile and desktop traffic with paid traffic, thus obtaining the valuable conclusion that most of the paid traffic comes from mobile and not desktop:

Segment overlap Google Analytics 4 - User exploration. Allows you to know information about specific groups of users.
- Cohort exploration. Although cohorts are very similar to segments, the difference between cohorts and segments is that a cohort is a group of users who share characteristics during a certain period while a segment is a group of users who share characteristics at any time.
Advertising in Google Analytics 4
The advertising section of Google Analytics 4 allows us to know which marketing strategies attract more traffic to our website or, in other words, through what places users come.
Before delving into the topic of advertising in this Google Analytics 4 course, it is necessary to know the following important GA4 terms:
- What is a conversion?. A conversion is an important event on our website or application, such as a purchase or the user subscribing to our newsletter.
- What is a channel?. A channel is the place through which the user visits our website, such as an advertisement, a YouTube video or Google search. In the Google documentation you have a list of all possible channel values.
- What is a key event path?. A key event path is the steps the user takes (touchpoints, which channels they go through) until they make a conversion (important action).
- How to mark an event as a conversion in GA4?. Simple, through the configuration section, we locate the event and mark it as a conversion. We need editing permission.
Therefore, we can say that the GA4 advertising section serves to know the channels that contribute the most conversions to our business. Let’s look at the most important parts:
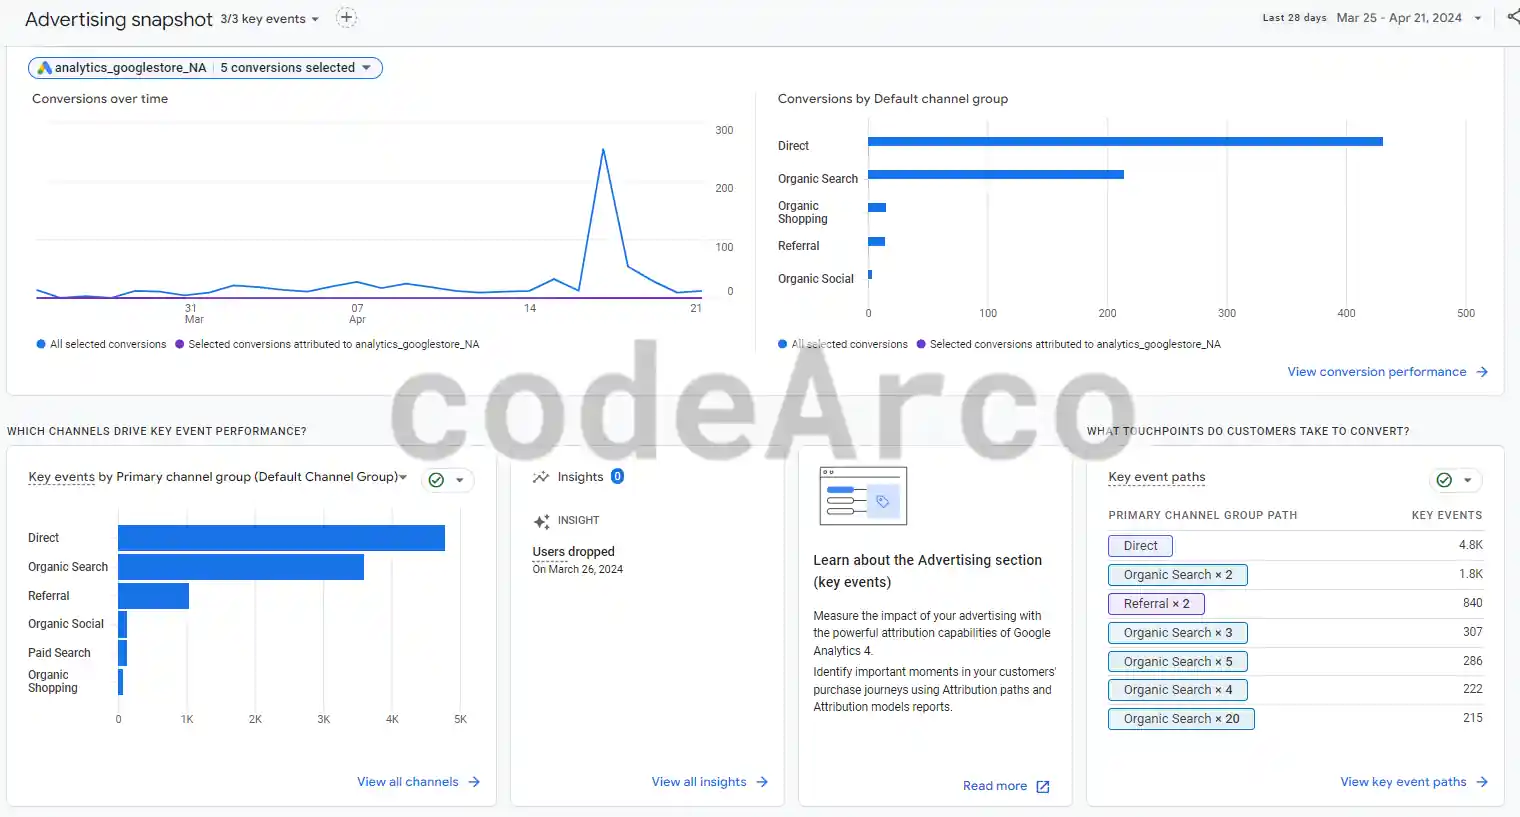
- Advertising snapshot. It allows us to observe, at a glance, the channels that provide the most conversions to our website and the key event paths (which we will talk about later), as well as a series of statistics.

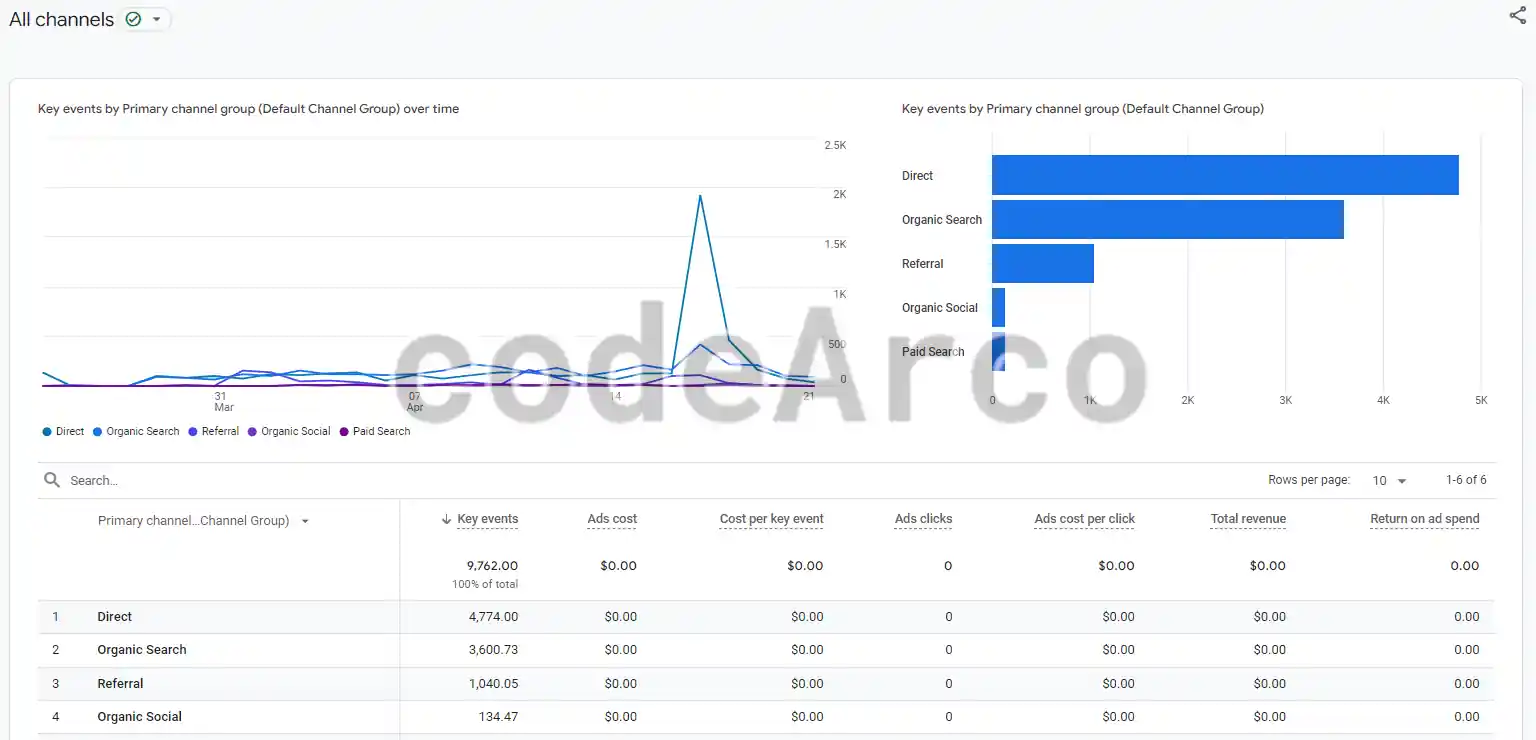
Advertising snapshot Google Analytics 4 - Channel performance. List of channels that bring us the most conversions in addition to certain interesting details such as, for example, the advertising cost of each channel, cost per conversion, total income per channel and ROI or return on investment per channel.

Channel Performance Google Analytics 4
What are key event paths?
Now, let’s stop and think for a moment… Today, very few users make a conversion (such as a purchase or adding a product to the cart) in the first interaction they have with our business, using a single channel.
The most common thing is that the user uses several channels prior to the conversion, such as:
- The user finds out about us through a Google Ads ad (first interaction or channel) but does not buy.
- Afterwards, the user becomes loyal to our business, gets to know us more and better, through YouTube and Facebook, but he still does not buy (interactions or intermediate channels).
- Finally, the user makes the conversion (purchase) through a website that links to us and that contains tutorials that use what we are selling as a product (interaction or final channel).
As we can see, the user has used several channels until the conversion is made, this is what is known as a key event path. In fact we have a section in Google Analytics 4 for key event paths:
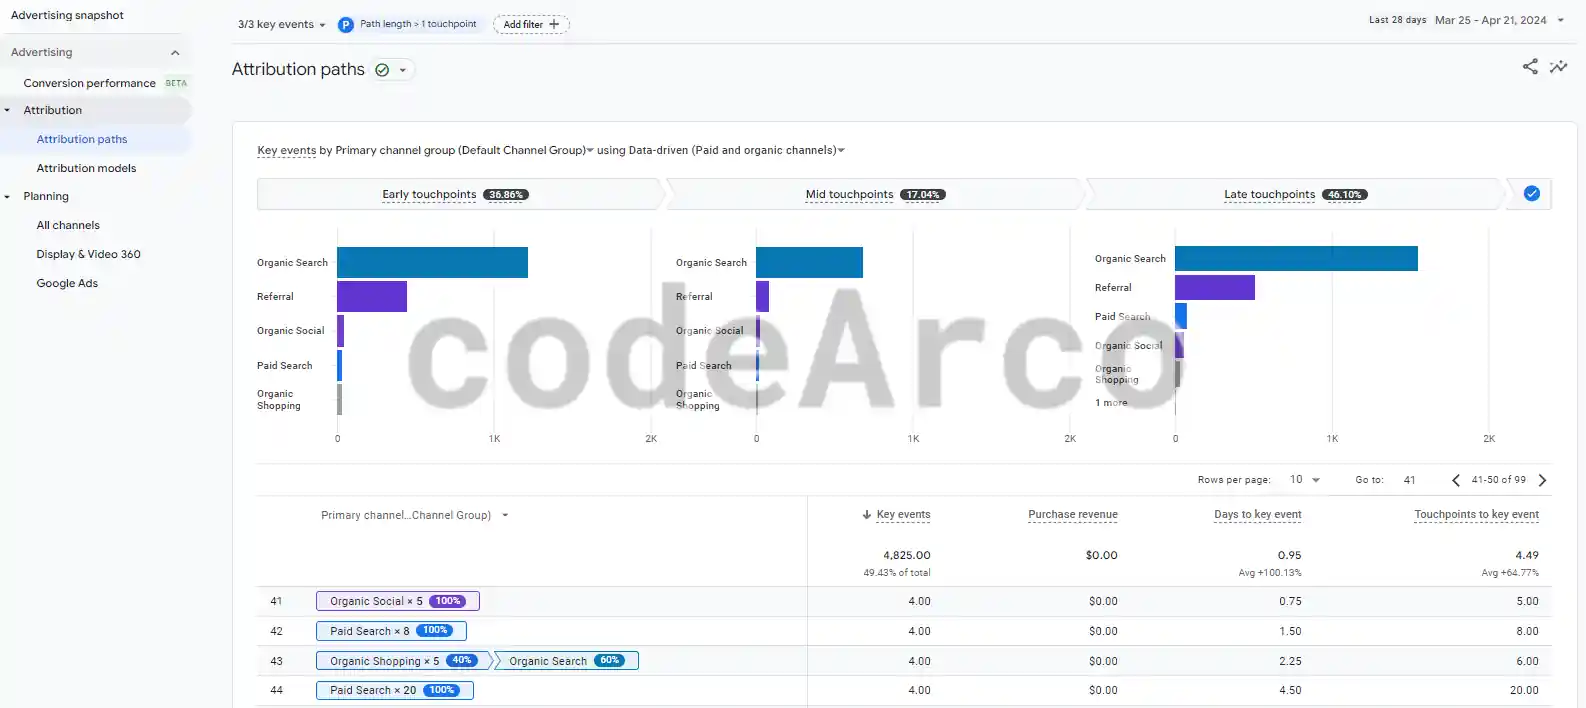
At the top we can filter by path length (in this case we have > 1 touchpoints) and by conversion events (in this case we have all, but we could filter only by purchases and add to cart, for example).
At the bottom we have a table that shows us which key event paths give us the most conversions as well as other data such as revenue derived, conversion days, and pre-conversion touchpoints.
According to the table in the previous image we have that the “Organic Social” route x5 (non-ad links on social sites like Facebook or Twitter) provides us with 4 conversions and the “Organic Shopping” x5 route (shopping search engines) followed by “Organic Search” (search with search engines) gives us 4 conversions.
The “X” in the key event paths indicate the number of touchpoints, so “Organic Search” x5 means that the user has interacted with our site 5 times through organic search.
Continuing with the table we can see that the same channel, such as, for example, “Paid Search”, appears several times in different positions, sometimes at the beginning, sometimes in the middle and sometimes at the end… This can lead us to wonder… In what position does paid search work better? That’s what the diagrams above are for.
In the diagrams above we can see which channels provide the most conversions depending on when they are used. From these diagrams we can draw the following conclusions:
- The organic search and referral channels work best at all points.
- Paid search channel is better at the final point of contact so we can draw the conclusion that this channel is the best through which purchases are made (leaving aside the previous ones).
- Organic social works better in the first steps, which means that it is more used by users to get to know us at first and, later, when purchasing, paid search works better.
- A good measure would be to put shopping links on social networks so that they work better than the paid search and in this way we would save money on ads.
What are attribution models?
At this point and, following the example we gave previously, where a user meets us through a Google Ads ad (initial point of contact, Cross-network) they become loyal to us through YouTube and Facebook (points of contact intermediates, Organic Social) and make the purchase through a website that links to us (final point of contact, Referral), the following question may arise… What is the channel that deserves the credit for the conversion (purchase)?, the initial one, the intermediate ones or the end?
We might think that the credit for the purchase goes to the last channel, to the website that links to us, but this is not entirely correct. In reality, all the channels used by the user influence the conversion (purchase decision) made by them.
This is where things get a little more complicated and GA4 attribution models come into play, which are a Google system that allows you to assign a conversion value to the different channels used by the user until the conversion is made. In other words, it allows us to measure how important or influential the channels with which the user has interacted before making a conversion on our website or application.
We have several attribution models in Google Analytics 4:
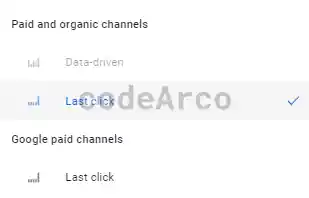
- Last click. All the credit for the conversion goes to the last channel used by the user, in our example it would be the link channel on the website (Referral).
- Data driven attribution. It uses a Google algorithm that we don’t know about, the only thing we know is that it uses machine learning and a good amount of information collected throughout the entire key event path.
In addition to the above, there are deprecated attribution models that are no longer used:
- First click. All the credit for the conversion goes to the first channel used by the user, in our example it would be the Google Ads ad channel (Cross-network).
- Linear. Distribute the credit equally among all the channels used by the user, in our example it would be the three channels equally.
- Position based. Give 40% importance to the first point of contact, another 40% to the last point of contact and the remaining 20% is distributed equally between the intermediate contact points.
- Time decay. Give more importance to the touchpoints closest to the conversion, decreasing the importance given as we get closer to the initial touchpoint.
At this point it is worth asking… Which Google attribution model is better? Well, like everything, it depends. There is no specific model that is the best, it depends on your needs and what you want to know:
- If what we want to know is through which channels users know us and then make a conversion, the best model would be the first click, ideal for startups and businesses that have just started.
- If what we want to know is what channels users use before conversion, the best model is the last click, ideal for established companies.
- If we want to know in a homogeneous way the channels that contribute the most conversions throughout the entire conversion route, the best model is the linear one or data driven, ideal if we want to get a homogeneous and equitable idea of all the channels that have contributed to the conversion.
- If we want to know the channels that provide the most conversions throughout the entire key event path but giving more importance to the initial and final contact points, the best model is the position-based one.
Additionally, we can compare the attribution models in the “Model comparison” section:
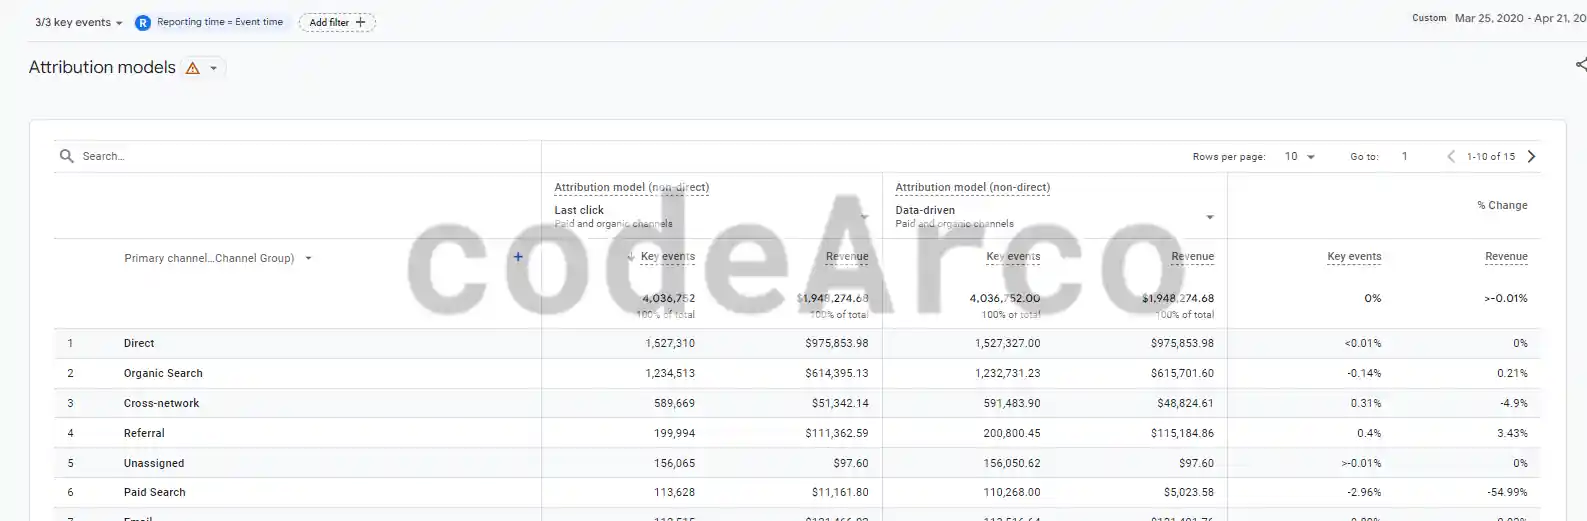
From the table above we can draw important conclusions such as, for example, that the organic search channel provides us with more conversions in the data driven model than in the last click model (at the end of the key event path).
This, in turn, can lead us to the conclusion that we have to give a boost to organic search at the final touchpoints with actions such as, for example, creating posts with tutorials with purchase links to our business that are positioned well on Google and encourage users to buy.
Finally, if this Google Analytics 4 course has fallen short and you still have doubts on the topic of advertising in GA4 and attribution models you can check the videos in the links above.
GA4 Search Box
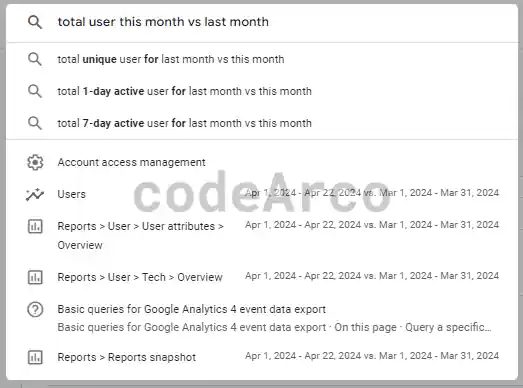
The search box of Google Analytics 4 allows us to:
- Search for specific reports and metrics.
- Using natural language, ask questions that will be answered through artificial intelligence, such as “total users during this month compared to last month.”
- Find the settings for an account or property.
- Seek help from GA4.